Fig. A.3.
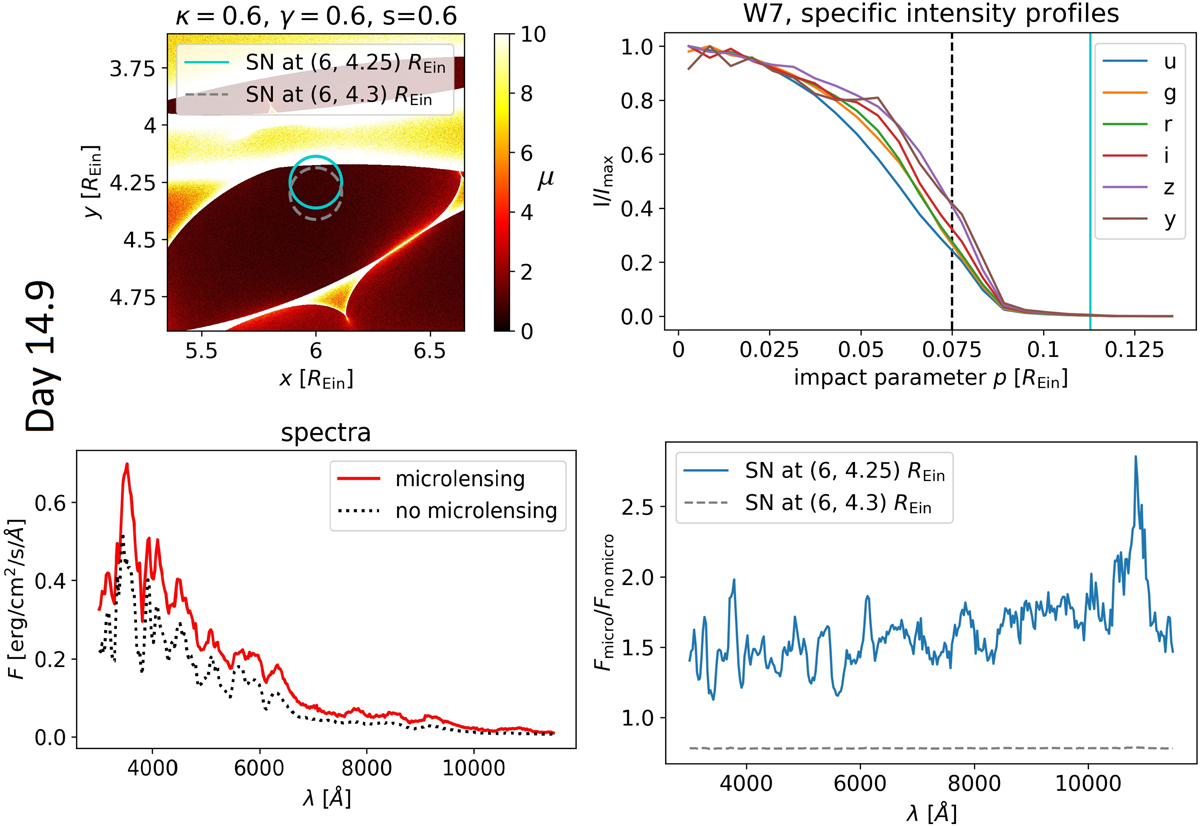
Effect of microlensing on SN Ia spectrum at rest-frame time t = 14.9 d after explosion, similar as in Fig. A.1 but at slightly different position of SN: (x, y) = (6, 4.25) REin, where REin = 7.2 × 10⁻³ pc = 2.2 × 1016 cm. For a better comparison, the case from Fig. A.1 is shown as gray dashed line in the upper-left and lower-right panels.
Current usage metrics show cumulative count of Article Views (full-text article views including HTML views, PDF and ePub downloads, according to the available data) and Abstracts Views on Vision4Press platform.
Data correspond to usage on the plateform after 2015. The current usage metrics is available 48-96 hours after online publication and is updated daily on week days.
Initial download of the metrics may take a while.