Open Access
Fig. 1.
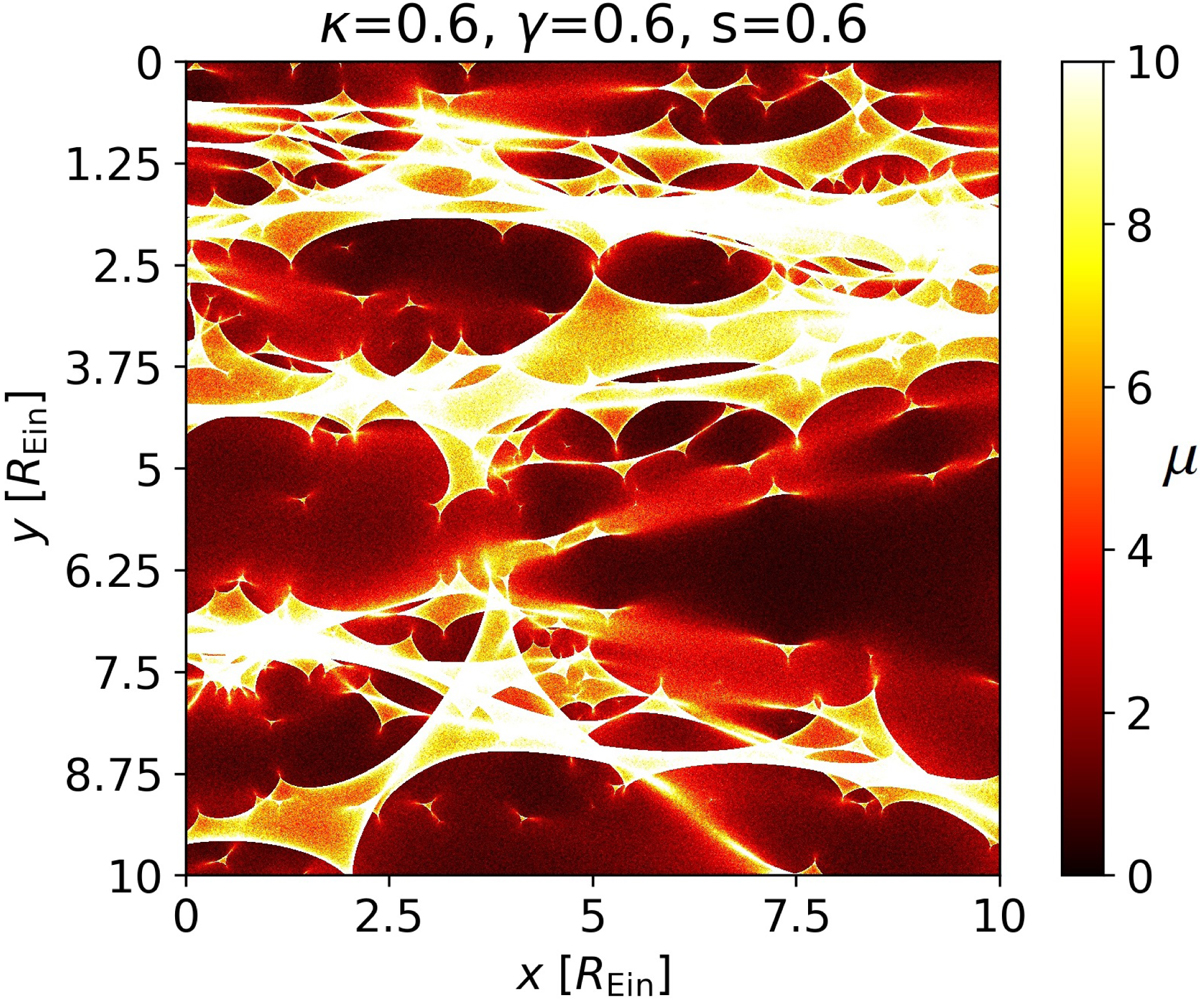
Example magnification map for κ = 0.6, γ = 0.6 and s = 0.6. The color scheme illustrates the different magnification factors μ at the source plane depending on the x and y coordinate. Many micro “caustics” are visible separating regions of high and low magnification.
Current usage metrics show cumulative count of Article Views (full-text article views including HTML views, PDF and ePub downloads, according to the available data) and Abstracts Views on Vision4Press platform.
Data correspond to usage on the plateform after 2015. The current usage metrics is available 48-96 hours after online publication and is updated daily on week days.
Initial download of the metrics may take a while.