Fig. 3.
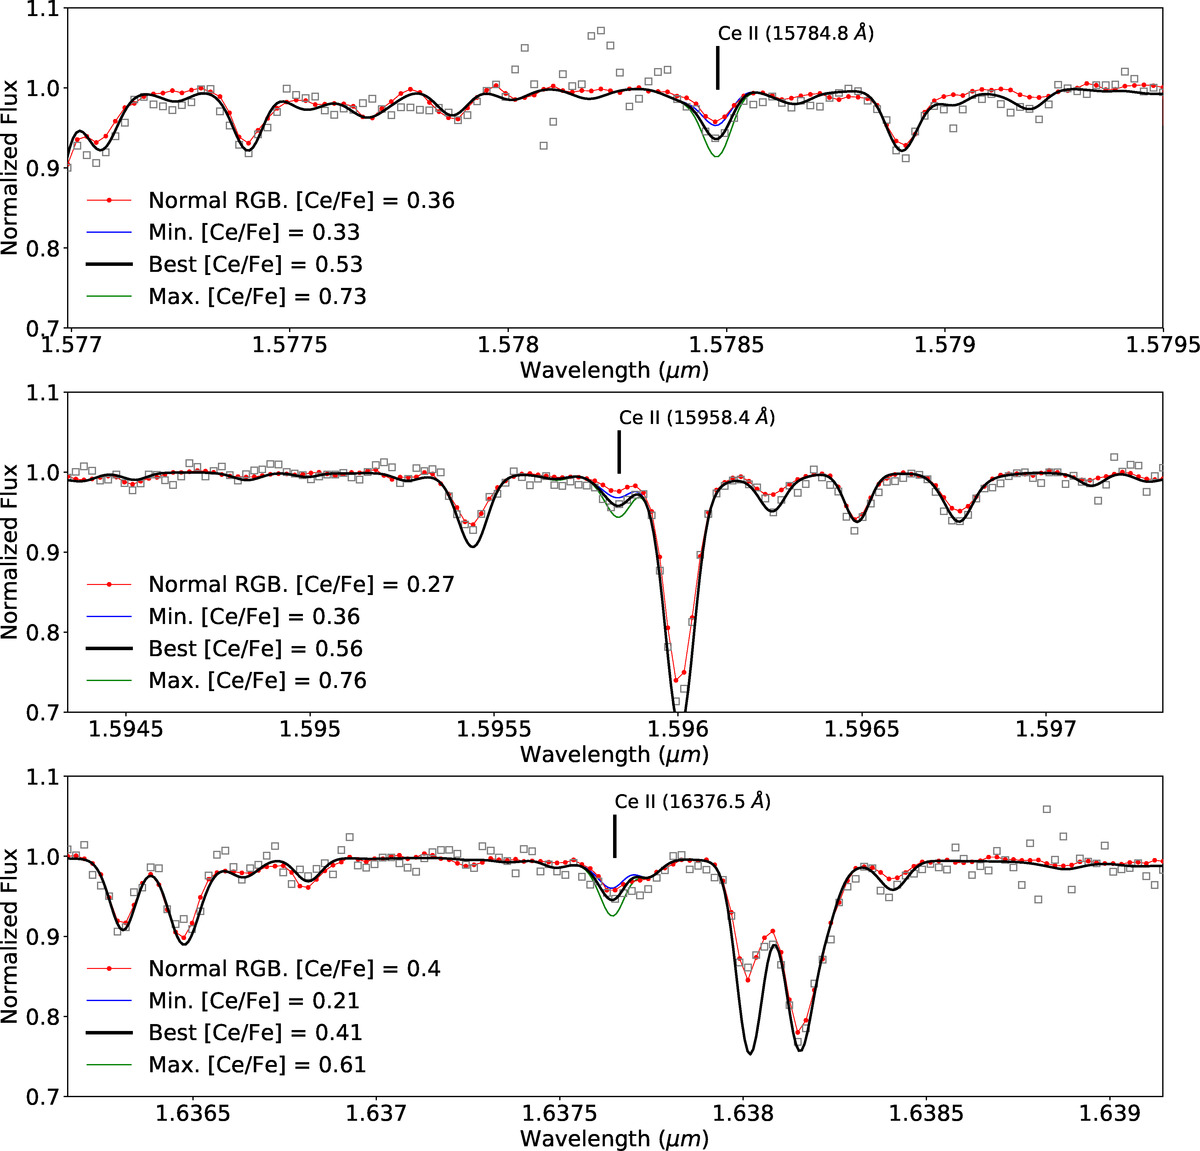
Example spectra and the fitted synthesis of Ce II lines for 2M12451043+1217401 in the observed infrared spectrum (gray unfilled squares). The printed best-fitted abundance (black thick line) values might not be the same as in Table 1 because the table contains averaged values, not individual fits. The blue and green lines correspond to synthetic spectrum abundance choices that are offset from the best fit by ± 0.2 dex. The spectrum of the N-rich star is compared to the spectrum of a normal star with [Ce/Fe] = +0.34 dex (the red line corresponds to APOGEE_ID: 2M12251747+1450078, labeled as Normal RGB), with similar stellar parameters.
Current usage metrics show cumulative count of Article Views (full-text article views including HTML views, PDF and ePub downloads, according to the available data) and Abstracts Views on Vision4Press platform.
Data correspond to usage on the plateform after 2015. The current usage metrics is available 48-96 hours after online publication and is updated daily on week days.
Initial download of the metrics may take a while.