Fig. 1.
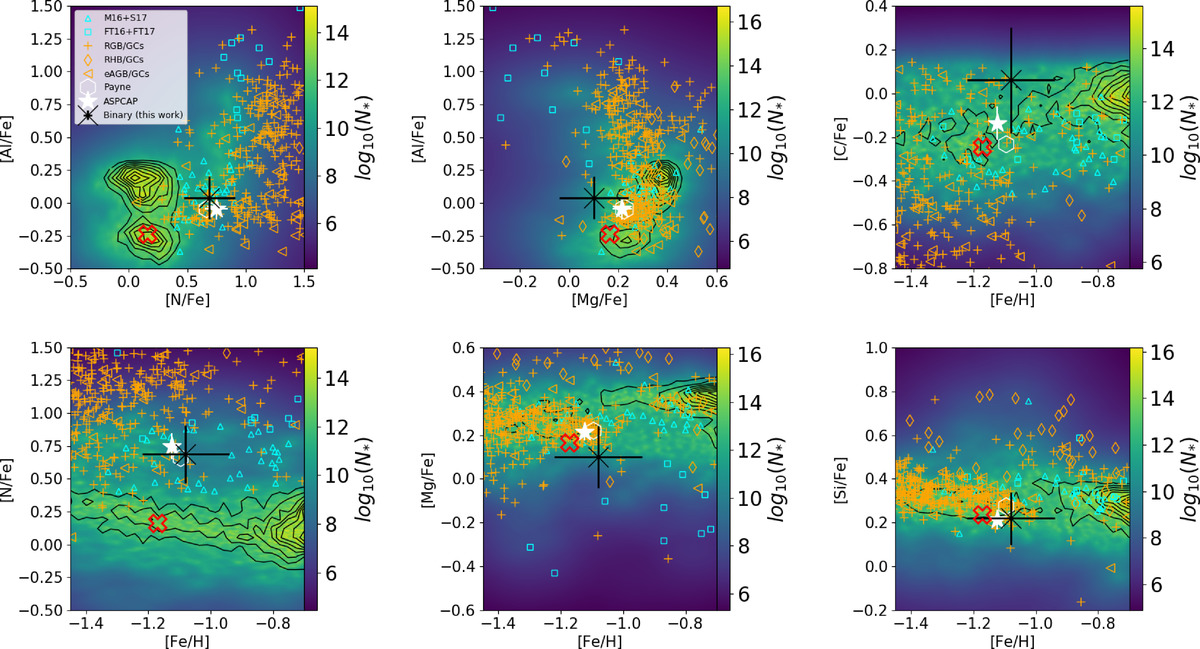
Background color in each panel: Kernel density estimate smoothed distribution of [Mg/Fe], [Al/Fe], [N/Fe], [C/Fe], [Si/Fe], and [Fe/H] of Payne-APOGEE stars. The black contours show the density of Milky Way stars with normal N abundance (≲ + 0.5); the new N-rich star, 2M12451043+1217401 (see text), is highlighted with a black symbol. The plotted error bar shows the classical standard deviation derived from the different abundances of the different lines for each element, as reported in Table 1. The same field sample is compared to APOGEE/BACCHUS determinations for RGB, eAGB, and RHB stars (orange symbols) in GCs, M13 ([Fe/H] = −1.53 ± 0.04), M3 ([Fe/H] = −1.50 ± 0.05), M5 ([Fe/H] = −1.29 ± 0.02), M107 ([Fe/H] = −1.02 ± 0.02), and M71 ([Fe/H] = −0.78 ± 0.02). A sample of known N-rich stars is plotted using small cyan symbols: unfilled triangles for stars reported in M16–Martell et al. (2016) and S17–Schiavon et al. (2017) from Payne-APOGEE abundances, and unfilled squares for stars studied in FT16–Fernández-Trincado et al. (2016b) and FT17–Fernández-Trincado et al. (2017). The red “X” unfilled symbol indicates the typical abundance patterns of a normal RGB star, 2M12251747+1450078, with similar metallicity and stellar parameters as 2M12451043+1217401.
Current usage metrics show cumulative count of Article Views (full-text article views including HTML views, PDF and ePub downloads, according to the available data) and Abstracts Views on Vision4Press platform.
Data correspond to usage on the plateform after 2015. The current usage metrics is available 48-96 hours after online publication and is updated daily on week days.
Initial download of the metrics may take a while.