Fig. 7
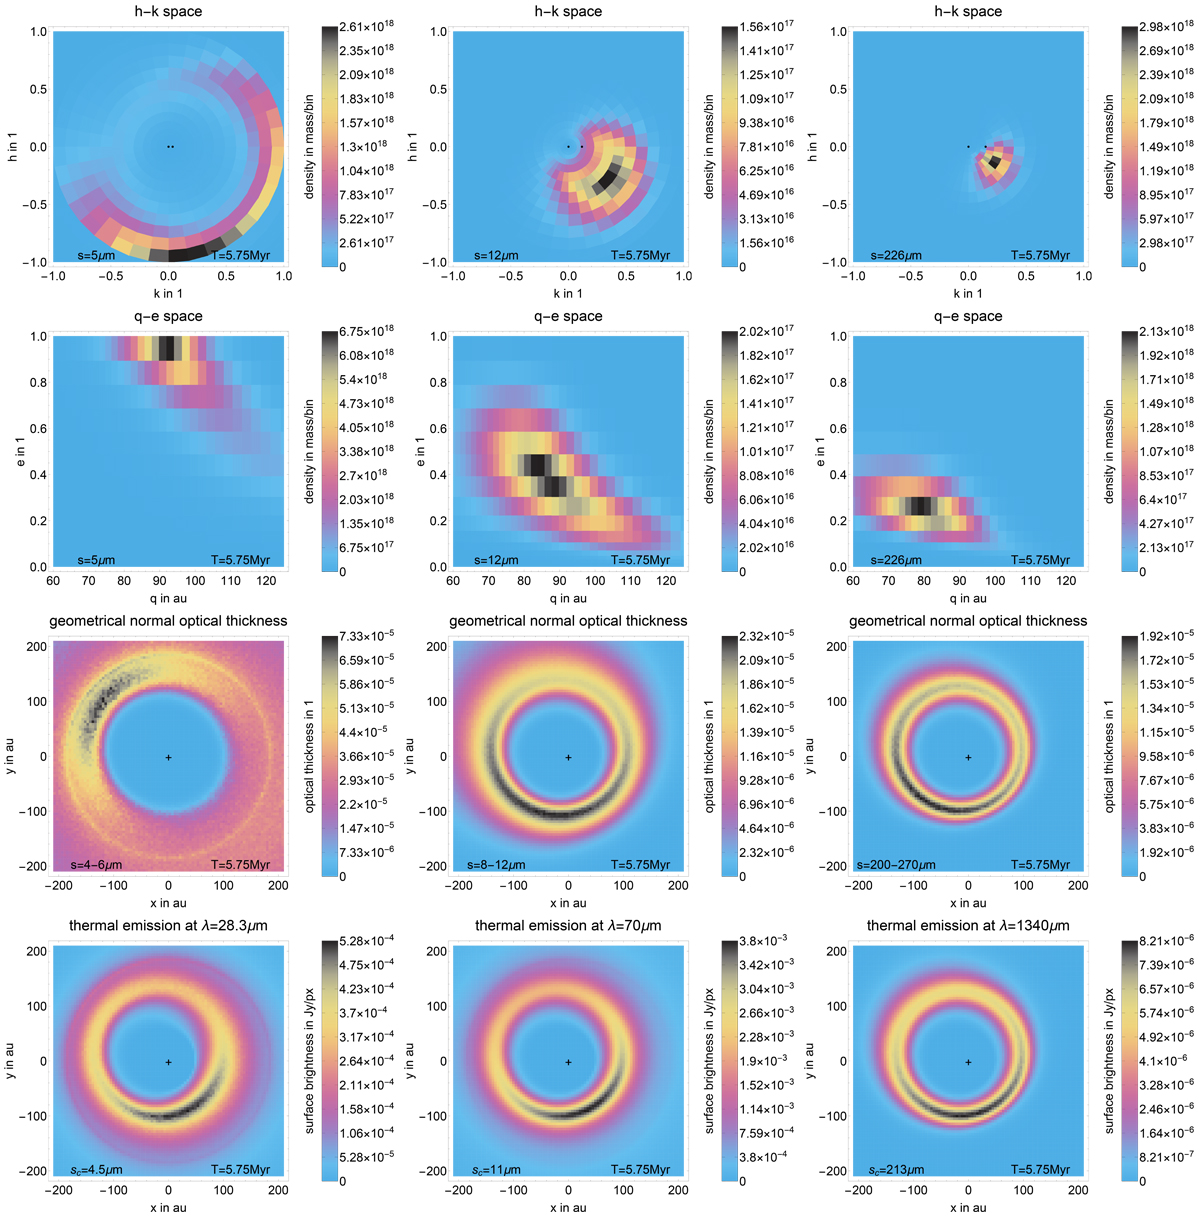
Results of the ACE simulation described in Sect. 3.4. First row: h–k phase space distribution, second row: q–e distribution,and third row: corresponding geometrical optical thickness. Each column shows a different particle size range: ≈ 5 μm (β ≈ 0.43) on the left, ≈12 μm (β ≈ 0.18) in the middle, and ≈226 μm (β ≈ 0.009) on the right. Fourth row: thermal emission over all particle sizes (without applying any instrument function). The characteristic wavelengths shown, match the particle sizes from the plots above.
Current usage metrics show cumulative count of Article Views (full-text article views including HTML views, PDF and ePub downloads, according to the available data) and Abstracts Views on Vision4Press platform.
Data correspond to usage on the plateform after 2015. The current usage metrics is available 48-96 hours after online publication and is updated daily on week days.
Initial download of the metrics may take a while.