Fig. 6
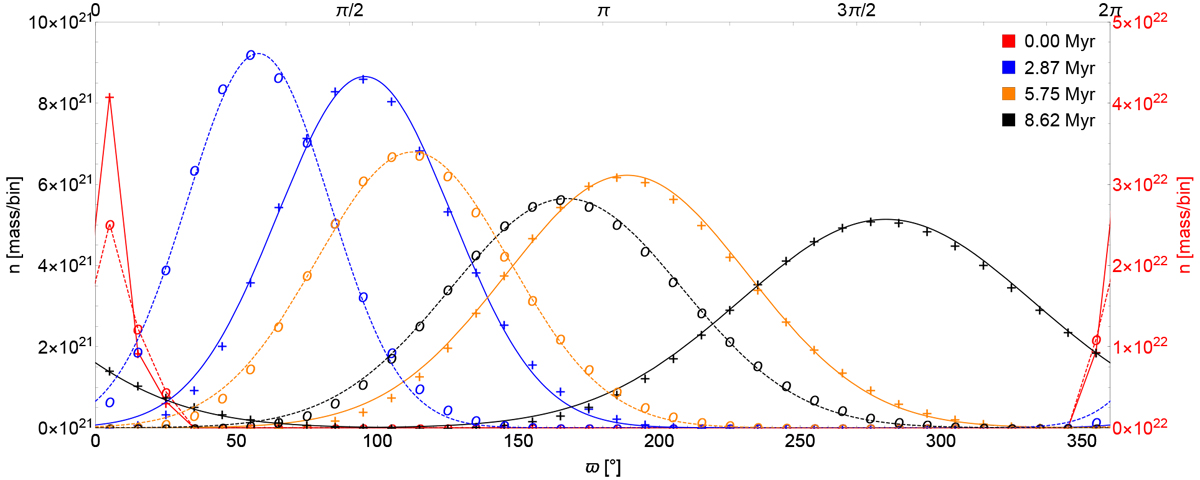
Azimuthal diffusion in the ACE simulation described in Sect. 3.2. The dust distribution of particles at a = 95 au (solid; crosses) and a = 110 au (dashed; circles) along the ϖ dimension is plotted for a simulation time of 0.00 Myr (red), 2.87 Myr (blue), 5.75 Myr (orange), and 8.62 Myr (black). A fit to the analytical solution was made to extract the different parameter velocities and dispersion coefficients. The initial distribution is scaled down by a factor of 5 to fit the plot.
Current usage metrics show cumulative count of Article Views (full-text article views including HTML views, PDF and ePub downloads, according to the available data) and Abstracts Views on Vision4Press platform.
Data correspond to usage on the plateform after 2015. The current usage metrics is available 48-96 hours after online publication and is updated daily on week days.
Initial download of the metrics may take a while.