Open Access
Fig. 2
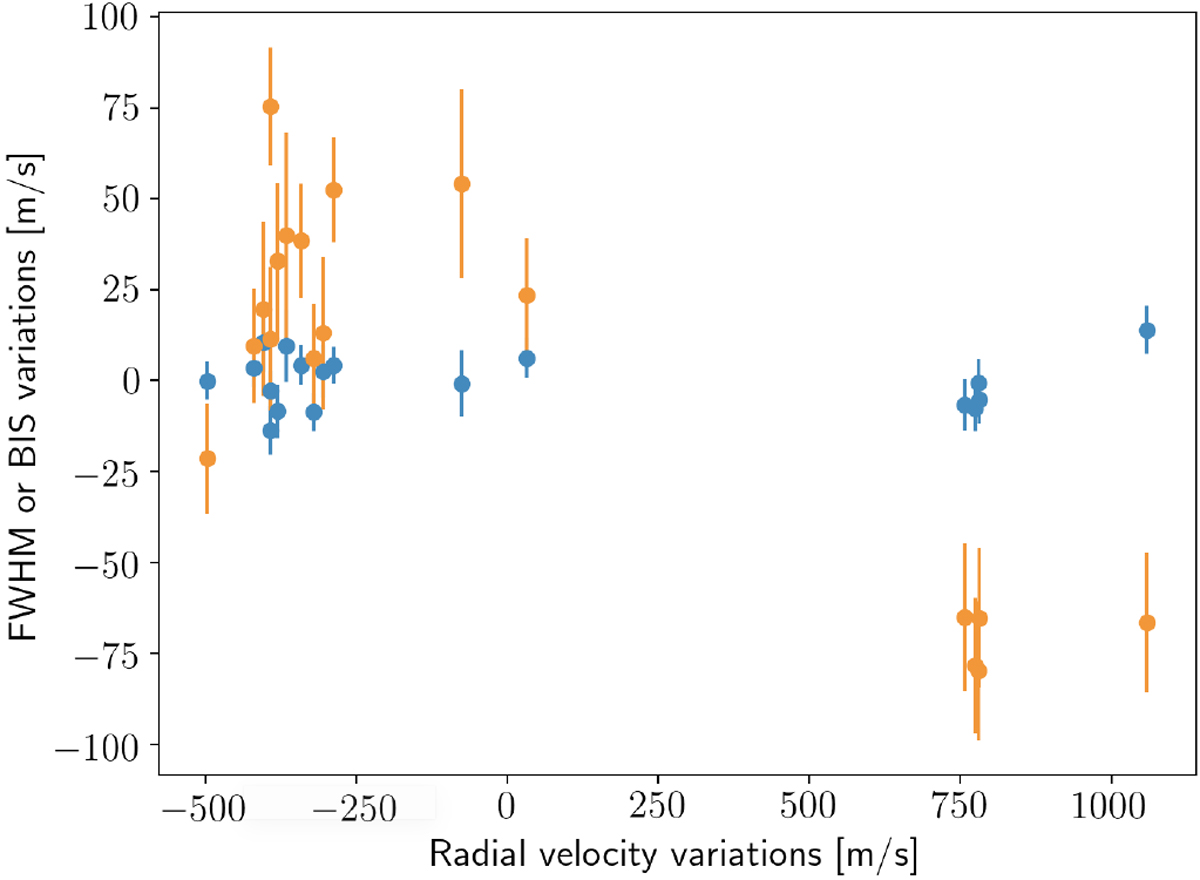
FWHM (orange) and bissector span (blue) variations of the cross-correlation function of HD 77712 spectra. The error bars are calculated from the RV uncertainties, multiplied by the factors given in Eq. (2).
Current usage metrics show cumulative count of Article Views (full-text article views including HTML views, PDF and ePub downloads, according to the available data) and Abstracts Views on Vision4Press platform.
Data correspond to usage on the plateform after 2015. The current usage metrics is available 48-96 hours after online publication and is updated daily on week days.
Initial download of the metrics may take a while.