Fig. 11
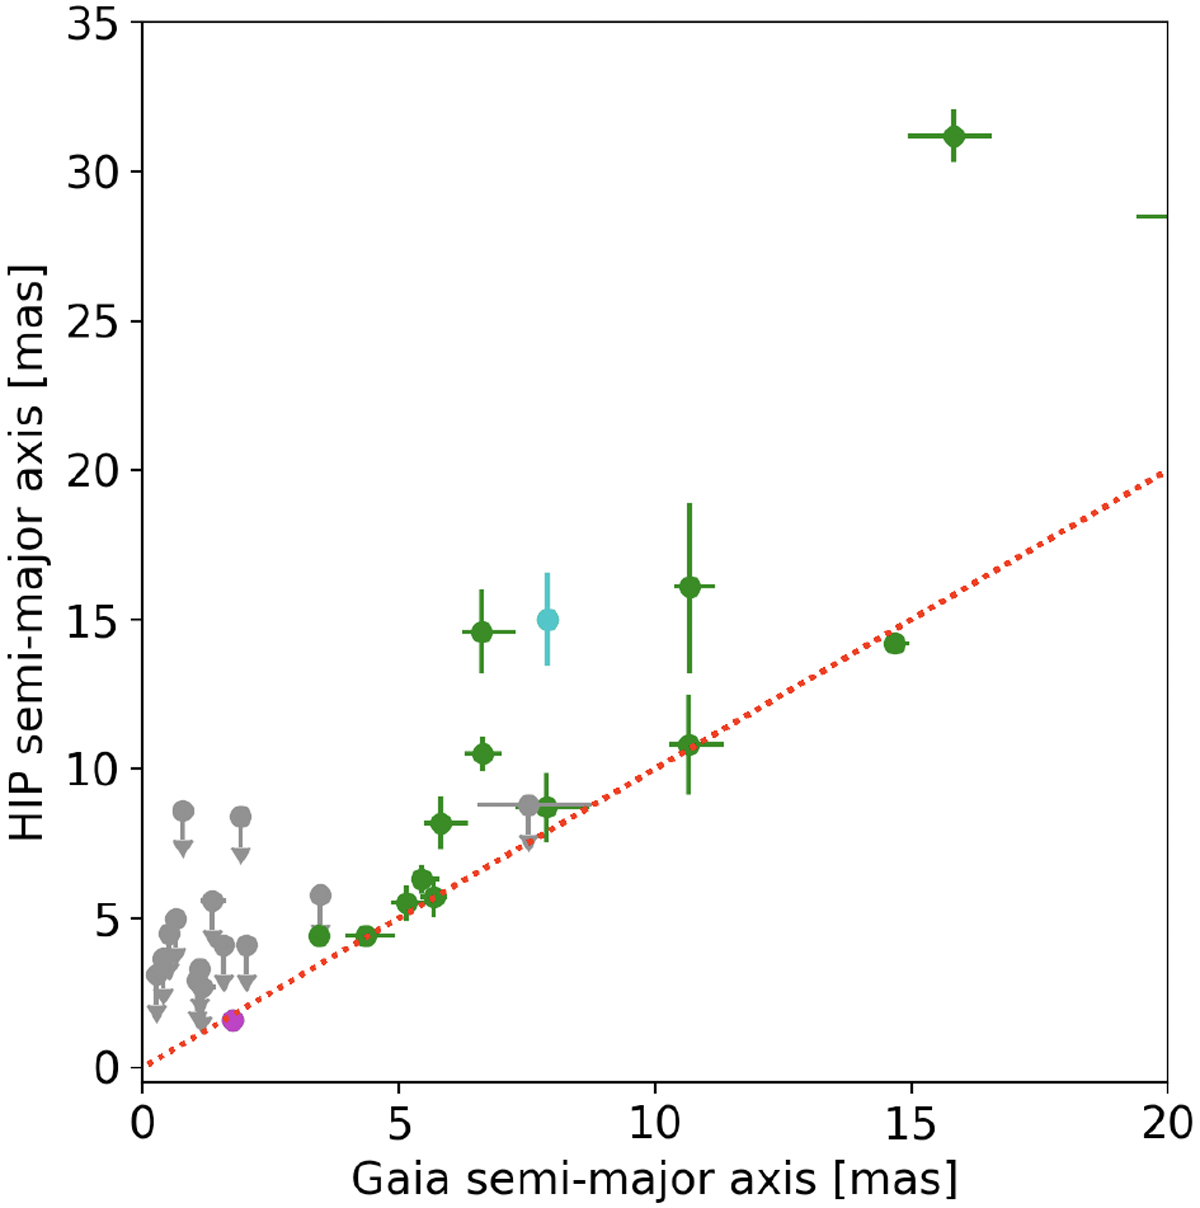
Direct comparison of Gaia and HIPPARCOS derivation of the semi-major axis of the photocentre when both are available. The colour code is the same as in Fig. 10. Grey points indicate upper limits derived with HIPPARCOS. The red dotted line represents the equality aHIP = aGaia. The outlyingpoint with aHIP = 32 mas is HD 225239. This case is discussed in Sect. 5.
Current usage metrics show cumulative count of Article Views (full-text article views including HTML views, PDF and ePub downloads, according to the available data) and Abstracts Views on Vision4Press platform.
Data correspond to usage on the plateform after 2015. The current usage metrics is available 48-96 hours after online publication and is updated daily on week days.
Initial download of the metrics may take a while.