Open Access
Fig. 1
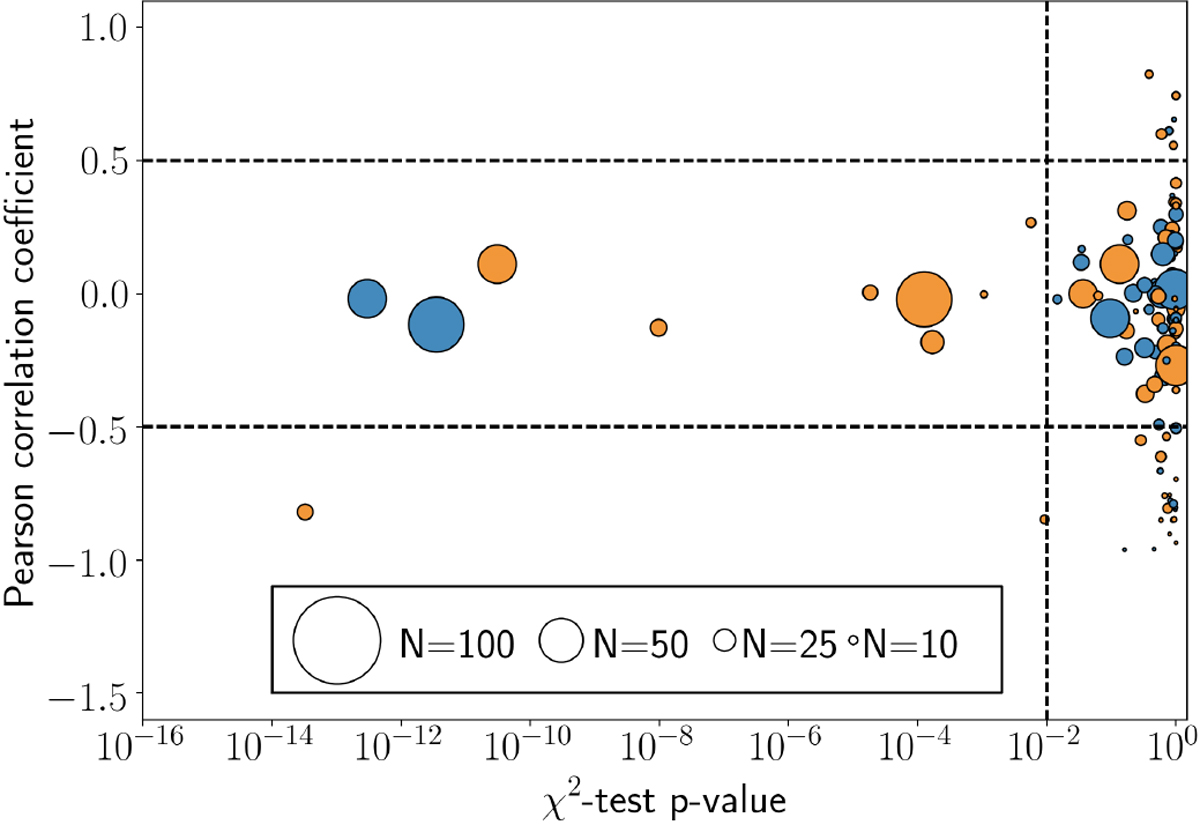
P-value of the χ2 -test vs. the Pearson correlation coefficient, R, for both FWHM (orange) and BIS (blue) indicators. The radii of the symbols are linearly scaled with the number of points considered. The dashed lines show the limits of significance for R (±0.5) and for the p-value at 3σ (<0.01).
Current usage metrics show cumulative count of Article Views (full-text article views including HTML views, PDF and ePub downloads, according to the available data) and Abstracts Views on Vision4Press platform.
Data correspond to usage on the plateform after 2015. The current usage metrics is available 48-96 hours after online publication and is updated daily on week days.
Initial download of the metrics may take a while.