Fig. 9.
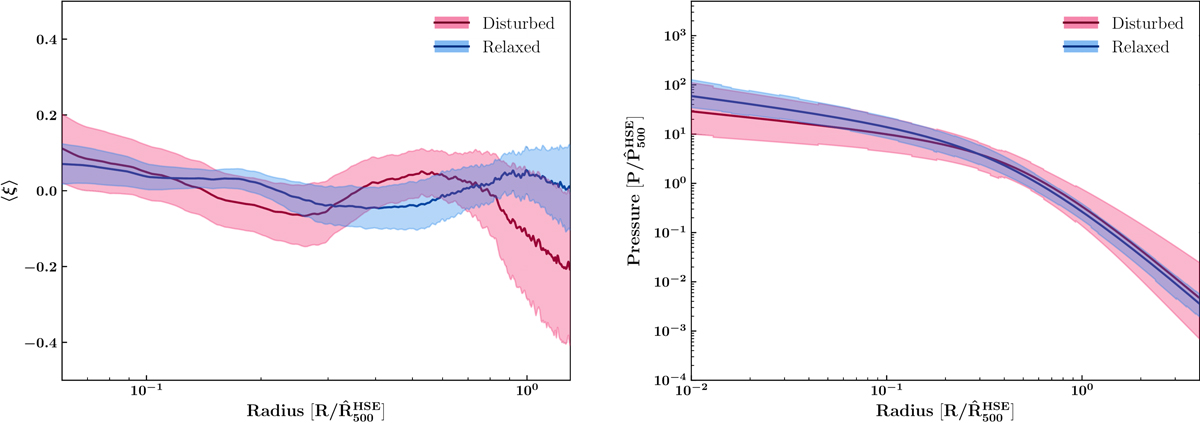
Left: mean relative difference between the NIKA2/Planck deprojected pressure profiles and those extracted from the MUSIC simulation, presented as a function of the normalized radius for the relaxed (blue) and the disturbed (red) cluster subsamples. The shaded regions represent the 1σ error on the mean. Right: mean normalized pressure profiles and associated 1σ scatter obtained from the profile distributions of relaxed (blue) and disturbed (red) clusters.
Current usage metrics show cumulative count of Article Views (full-text article views including HTML views, PDF and ePub downloads, according to the available data) and Abstracts Views on Vision4Press platform.
Data correspond to usage on the plateform after 2015. The current usage metrics is available 48-96 hours after online publication and is updated daily on week days.
Initial download of the metrics may take a while.