Fig. 8.
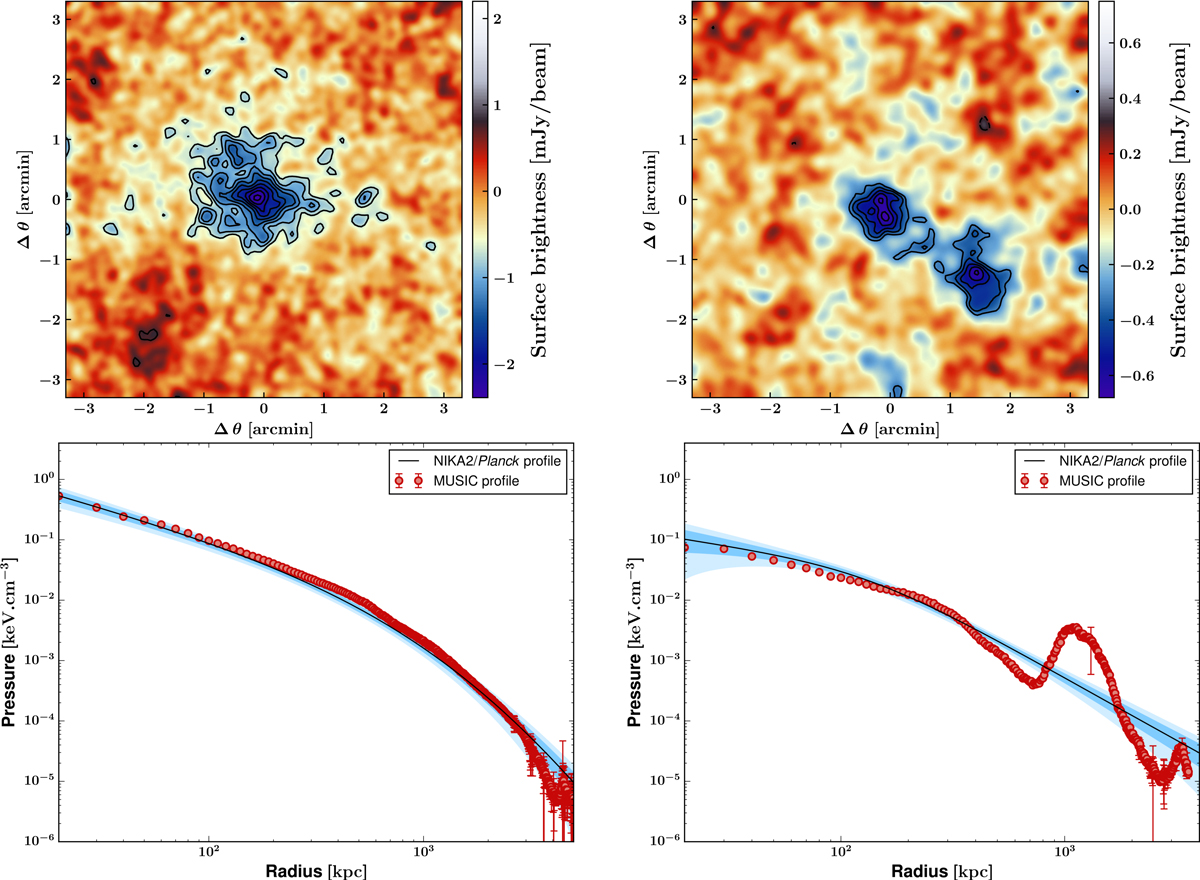
Upper panels: simulated NIKA2 tSZ surface brightness maps for a relaxed (left) and a disturbed (right) cluster. The signal-to-noise contours (black lines) start at 3σ with 1σ steps. Lower panels: pressure profiles estimated at the maximum likelihood from the MCMC analysis of the maps shown in the above panels (black line) and associated 1 and 2σ uncertainties (dark blue and light blue regions). The pressure profiles extracted from the MUSIC simulation for each cluster are represented by the red dots with 1σ error bars. A radius of 100 kpc corresponds to an angular scale of 15.3 arcsec and 12.8 arcsec for the left and right panel, respectively.
Current usage metrics show cumulative count of Article Views (full-text article views including HTML views, PDF and ePub downloads, according to the available data) and Abstracts Views on Vision4Press platform.
Data correspond to usage on the plateform after 2015. The current usage metrics is available 48-96 hours after online publication and is updated daily on week days.
Initial download of the metrics may take a while.