Fig. 7.
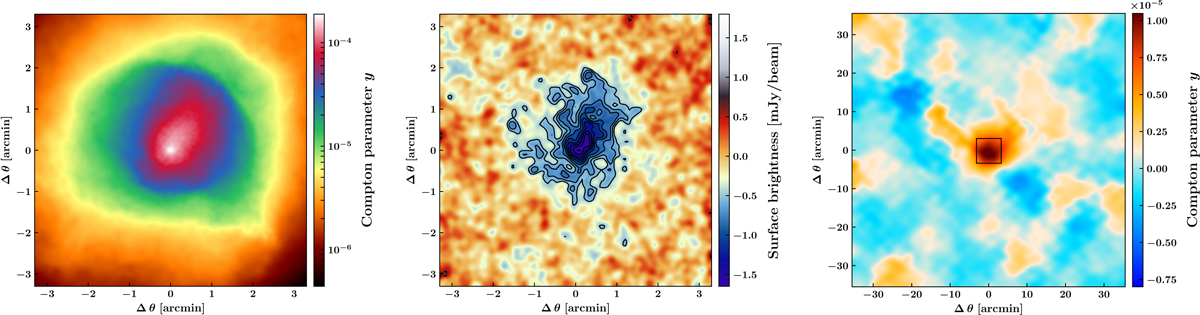
Left: MUSIC Compton parameter map of a selected disturbed cluster in the first redshift bin. An ICM extension is clearly identified in the upper right region of the map. Middle: simulated NIKA2 tSZ surface brightness map at 150 GHz of the MUSIC cluster shown in the left panel. Right: simulated Planck Compton parameter map of the MUSIC cluster shown in the left panel. The field of view considered for the left and middle panels is shown as a black rectangle at the center of the map.
Current usage metrics show cumulative count of Article Views (full-text article views including HTML views, PDF and ePub downloads, according to the available data) and Abstracts Views on Vision4Press platform.
Data correspond to usage on the plateform after 2015. The current usage metrics is available 48-96 hours after online publication and is updated daily on week days.
Initial download of the metrics may take a while.