Fig. 4.
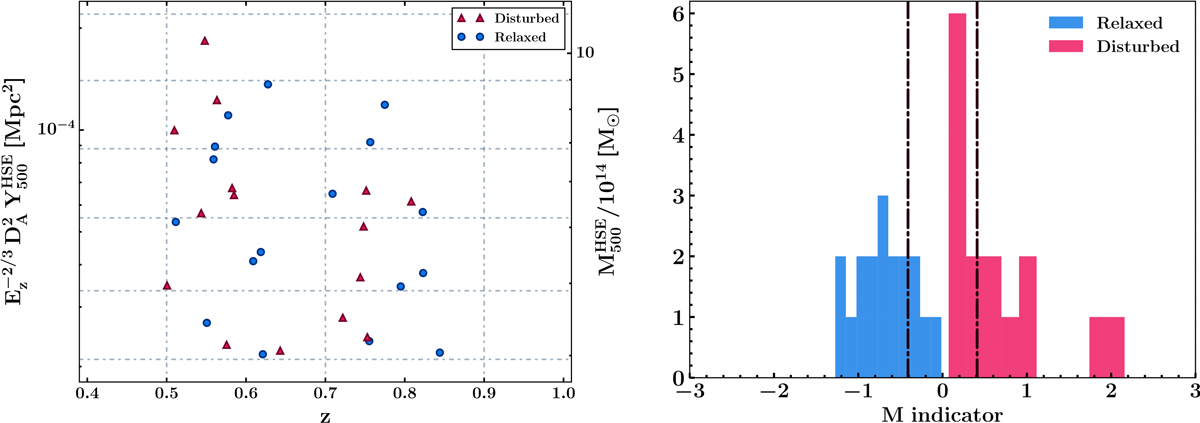
Left: distribution of the selected MUSIC clusters in the mass-redshift plane. The mass and redshift bins considered are identical to those of NIKA2 SZ large program. The redshifts in each bins are generated randomly using a uniform distribution within their respective boundaries for display reasons. Morphologically relaxed and disturbed clusters are indicated by blue dots and red triangles, respectively. Right: distributions of the morphological indicators computed for the selected MUSIC clusters for the relaxed (blue) and disturbed (red) subsamples. The vertical dash-dotted lines enclose the population of clusters with a hybrid dynamical state (see Sect. 4.1).
Current usage metrics show cumulative count of Article Views (full-text article views including HTML views, PDF and ePub downloads, according to the available data) and Abstracts Views on Vision4Press platform.
Data correspond to usage on the plateform after 2015. The current usage metrics is available 48-96 hours after online publication and is updated daily on week days.
Initial download of the metrics may take a while.