Fig. 3.
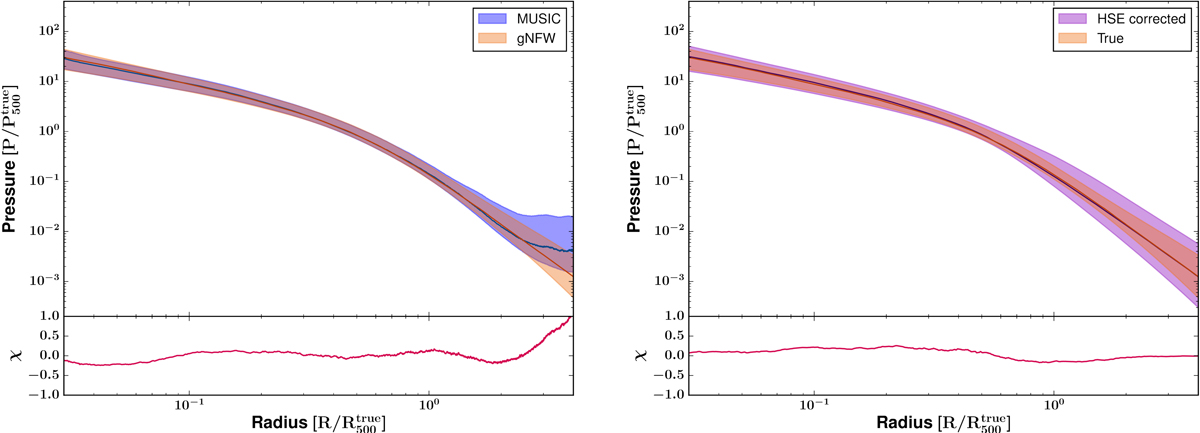
Left: mean normalized pressure profiles estimated by considering the profiles extracted from the MUSIC simulation (blue) and the gNFW fits of these profiles (orange) for each cluster at z = 0.54 and z = 0.82. Right: mean pressure profiles obtained by normalizing the gNFW profiles associated with each MUSIC cluster by the values of ![]() and
and ![]() (orange) and by the values of
(orange) and by the values of ![]() and
and ![]() obtained after correction of the hydrostatic mass of each cluster by the mean hydrostatic bias of the MUSIC simulation at the two considered redshifts (magenta). The differences between the two profiles divided by the mean of their associated uncertainties are shown in red in each lower panel.
obtained after correction of the hydrostatic mass of each cluster by the mean hydrostatic bias of the MUSIC simulation at the two considered redshifts (magenta). The differences between the two profiles divided by the mean of their associated uncertainties are shown in red in each lower panel.
Current usage metrics show cumulative count of Article Views (full-text article views including HTML views, PDF and ePub downloads, according to the available data) and Abstracts Views on Vision4Press platform.
Data correspond to usage on the plateform after 2015. The current usage metrics is available 48-96 hours after online publication and is updated daily on week days.
Initial download of the metrics may take a while.