Fig. 2.
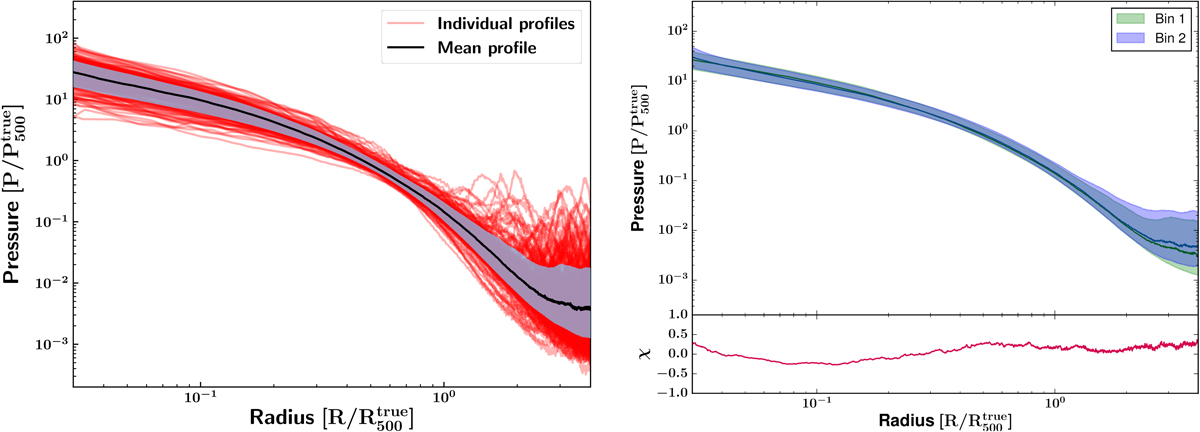
Left: normalized pressure profiles extracted from the MUSIC simulation for all the clusters located at a redshift z = 0.54 (red lines). The mean pressure profile is represented in black and the intrinsic scatter of the distribution at 1σ is given by the blue region. Right: comparison of the mean normalized pressure profiles estimated from the MUSIC profiles extracted at z = 0.54 (green), and at z = 0.82 (blue). The difference between the two profiles divided by the mean of their associated uncertainties is shown in red in the lower panel.
Current usage metrics show cumulative count of Article Views (full-text article views including HTML views, PDF and ePub downloads, according to the available data) and Abstracts Views on Vision4Press platform.
Data correspond to usage on the plateform after 2015. The current usage metrics is available 48-96 hours after online publication and is updated daily on week days.
Initial download of the metrics may take a while.