Fig. 10.
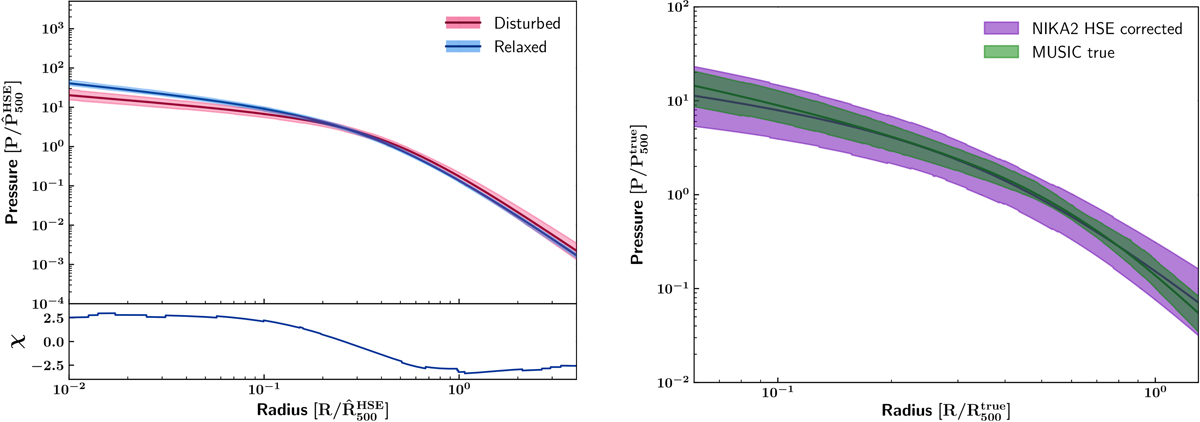
Left: mean normalized pressure profiles and associated 1σ error on the mean for the relaxed (blue) and disturbed (red) clusters. The difference between the two profiles divided by the mean of their associated uncertainties is shown with the dark blue line in the lower panel. Right: mean normalized pressure profiles and associated 1σ scatter for the whole sample of selected clusters computed from the true MUSIC pressure profiles (green) and for the NIKA2/Planck deprojected profiles (purple) after normalization by the integrated quantities corrected from the mean hydrostatic bias (see Sect. 3.3).
Current usage metrics show cumulative count of Article Views (full-text article views including HTML views, PDF and ePub downloads, according to the available data) and Abstracts Views on Vision4Press platform.
Data correspond to usage on the plateform after 2015. The current usage metrics is available 48-96 hours after online publication and is updated daily on week days.
Initial download of the metrics may take a while.