Fig. 1.
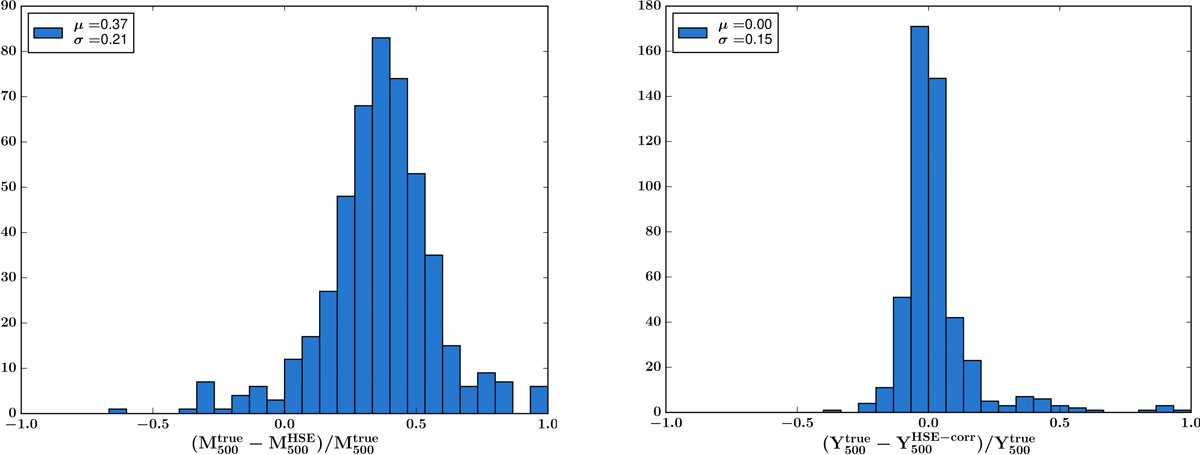
Left: distribution of the hydrostatic bias values computed for all MUSIC clusters at redshifts z = 0.54 and z = 0.82. Right: distribution of the bias on the corrected integrated Compton parameter for the same clusters. The mean and the standard deviation of each histogram are indicated in the upper left corner of the panels.
Current usage metrics show cumulative count of Article Views (full-text article views including HTML views, PDF and ePub downloads, according to the available data) and Abstracts Views on Vision4Press platform.
Data correspond to usage on the plateform after 2015. The current usage metrics is available 48-96 hours after online publication and is updated daily on week days.
Initial download of the metrics may take a while.