Fig. 9.
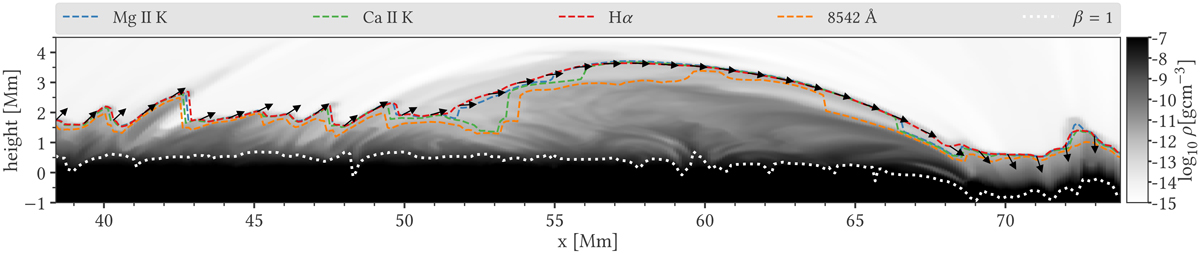
Mass density in a vertical cut through the model atmosphere along the blue line in Fig. 8. For each spectral line mentioned in the legend, corresponding dashed curves show the maximum formation height at optical depth unity. The white dotted line shows the first occurrence from the upper convection zone where the magnetic pressure equals gas pressure (β = 1). The arrows show the direction of the magnetic field vector in the plane of the cut along the formation height curve of Hα. These arrows are plotted every tenth grid point.
Current usage metrics show cumulative count of Article Views (full-text article views including HTML views, PDF and ePub downloads, according to the available data) and Abstracts Views on Vision4Press platform.
Data correspond to usage on the plateform after 2015. The current usage metrics is available 48-96 hours after online publication and is updated daily on week days.
Initial download of the metrics may take a while.