Fig. 8.
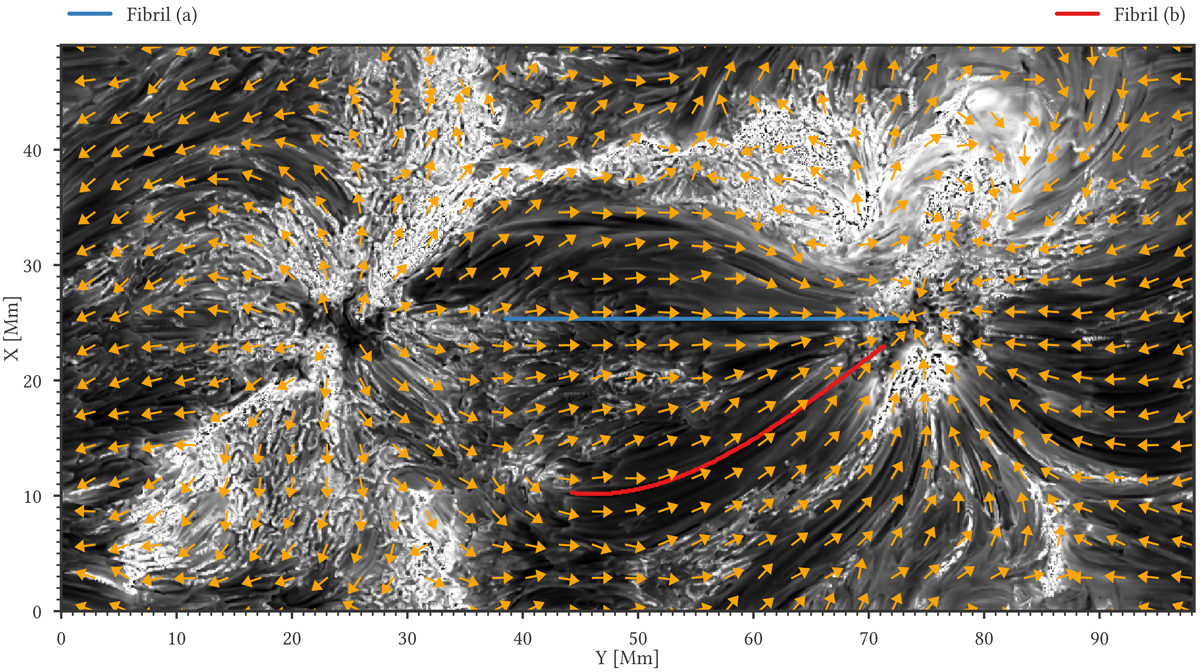
Image of Hα at nominal line center overplotted with the horizontal magnetic field directions (orange arrows) at the formation height. The arrows are plotted every 30th grid point. The visibility of Hα fibrils is artificially enhanced using unsharp masking. The blue and red lines indicate two slices along selected fibrils illustrated in Figs. 9 (blue) and 10 (blue and red).
Current usage metrics show cumulative count of Article Views (full-text article views including HTML views, PDF and ePub downloads, according to the available data) and Abstracts Views on Vision4Press platform.
Data correspond to usage on the plateform after 2015. The current usage metrics is available 48-96 hours after online publication and is updated daily on week days.
Initial download of the metrics may take a while.