Fig. 7.
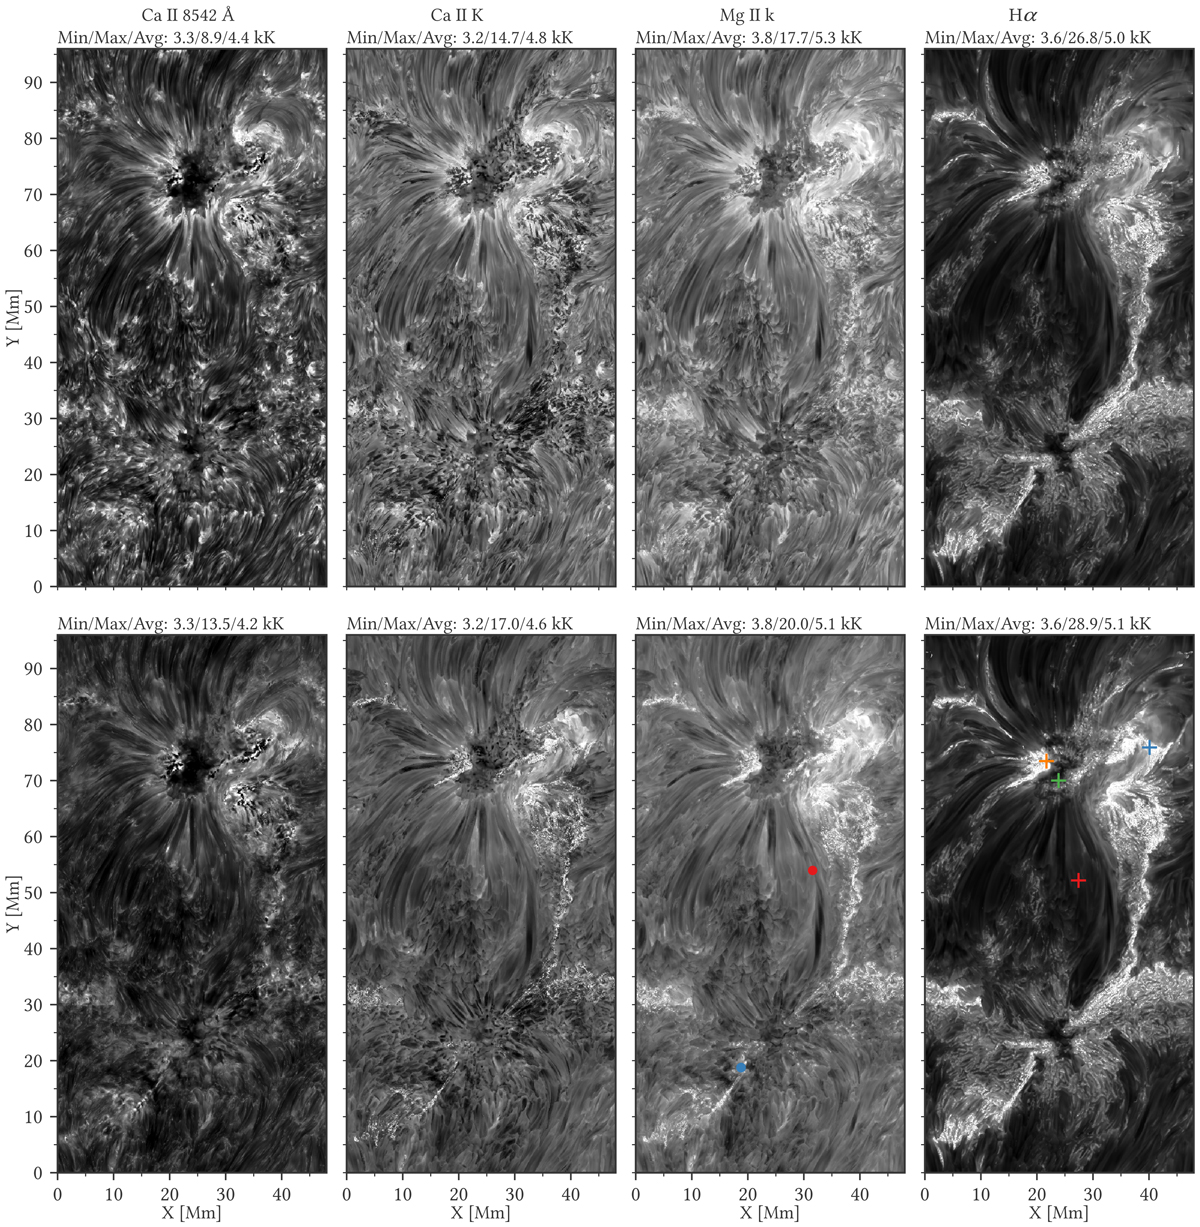
Simulated images of Ca II 8542 Å, Ca II K, Mg II k, and Hα from the model atmosphere in vertically emergent intensity. Top row: at nominal line center, Δλ = 0 Å. Bottom row: at wavelengths corresponding to the maximum formation height, maxz(τ = 1). Intensity is expressed as brightness temperature Tb and is clipped to same ranges in each column: 3.6–7 kK for Ca II 8 542 Å, 3.6–7 kK for Ca II K, 3.6–8 kK for Mg II k, and 3.6–10 kK for Hα. The minimum, maximum, and average Tb for the entire FOV is provided in a label above each panel. Colored symbols indicate the following structures: a dark fibril (red dot) and a flare ribbon (blue dot), see Fig. 4; an active region in emission (orange cross), see Fig. 12; an active region in emission with a strong velocity gradient (blue cross), see Fig. 13; a sunspot (green cross), see Fig. 14; a fibril (red cross), see Fig. 15.
Current usage metrics show cumulative count of Article Views (full-text article views including HTML views, PDF and ePub downloads, according to the available data) and Abstracts Views on Vision4Press platform.
Data correspond to usage on the plateform after 2015. The current usage metrics is available 48-96 hours after online publication and is updated daily on week days.
Initial download of the metrics may take a while.