Fig. 4.
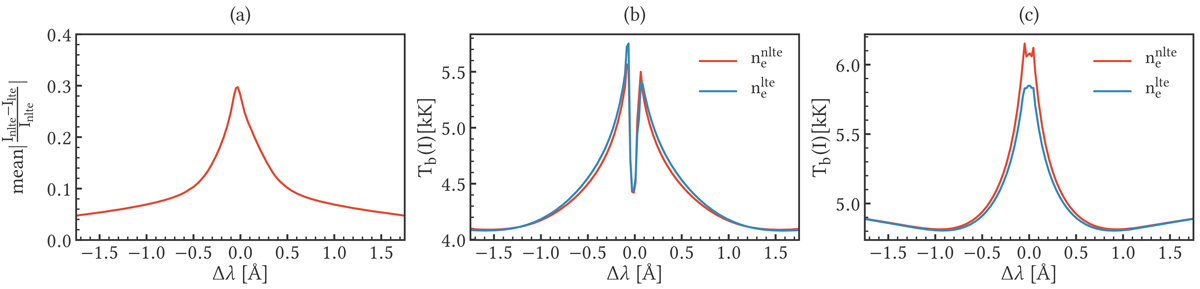
Dependence of the vertically emergent intensity in Mg II k on how the electron density is computed. Panel a: spatially averaged relative change in the intensity, which is computed using either non-LTE or LTE electron densities. Panels b,c: line intensities expressed as brightness temperature Tb and computed using LTE (blue) or non-LTE (red) electron density at two structures indicated in Fig. 7. Panel b: dark fibril, red dot in Fig. 7. Panel c: flare ribbon, blue dot in Fig. 7.
Current usage metrics show cumulative count of Article Views (full-text article views including HTML views, PDF and ePub downloads, according to the available data) and Abstracts Views on Vision4Press platform.
Data correspond to usage on the plateform after 2015. The current usage metrics is available 48-96 hours after online publication and is updated daily on week days.
Initial download of the metrics may take a while.