Fig. 3.
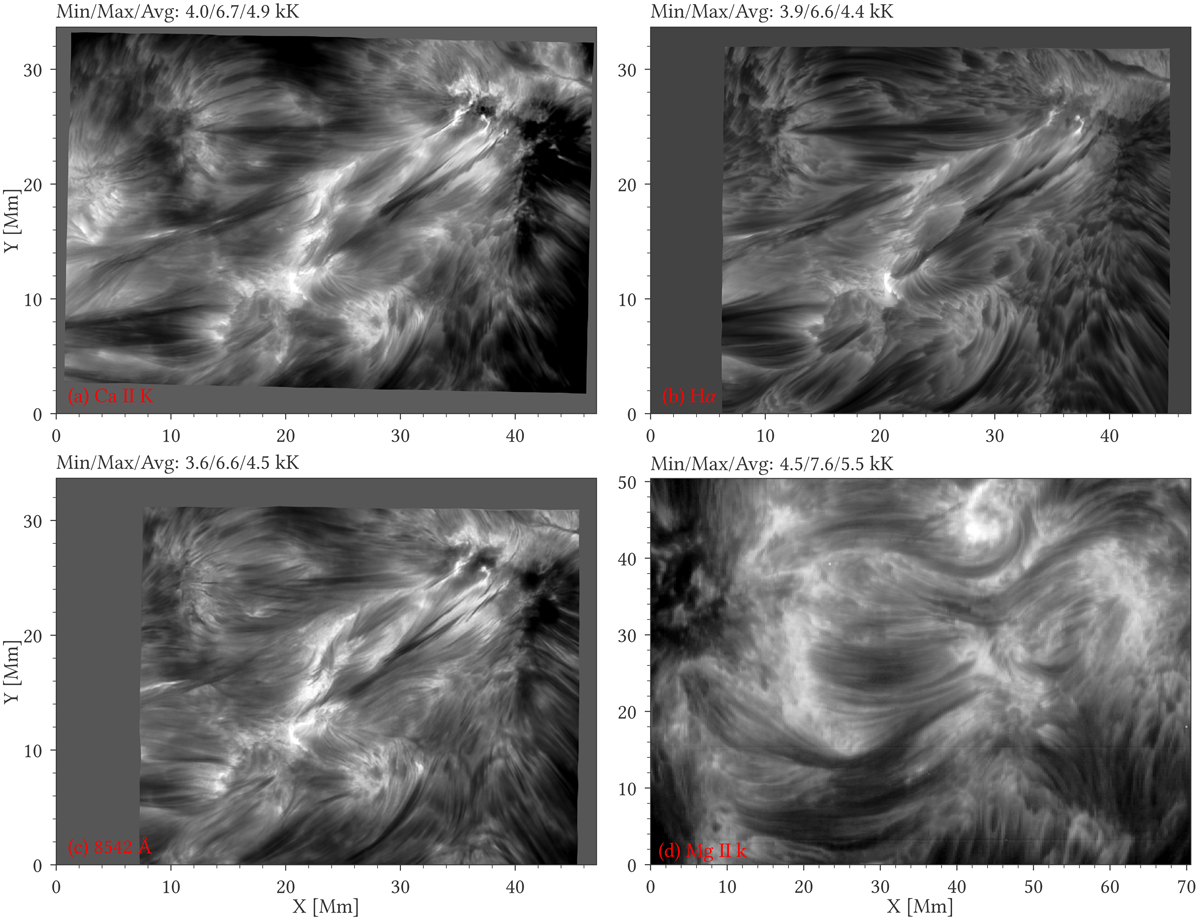
Observations of two active regions close to the disk center at the nominal line center of (a) Ca II K (SST/CHROMIS), (b) Hα (SST/CRISP), (c) Ca II 8542 Å (SST/CRISP), and (d) Mg II k (IRIS). Panels a–c: NOAA 12593. Panel d: NOAA 12494. The images are given in brightness temperature Tb and are clipped at 4.5–6 K for Ca II K, 3.9–6 Kk for Hα, 3.8–6 kK for 8542 Å, and 4.7–7 kK for Mg II k. Above the top left corner of each panel we show the minimum, maximum, and average brightness temperature for the FOV. Panels a–c have the same coordinate scale, while panel d has a different scale.
Current usage metrics show cumulative count of Article Views (full-text article views including HTML views, PDF and ePub downloads, according to the available data) and Abstracts Views on Vision4Press platform.
Data correspond to usage on the plateform after 2015. The current usage metrics is available 48-96 hours after online publication and is updated daily on week days.
Initial download of the metrics may take a while.