Fig. 12.
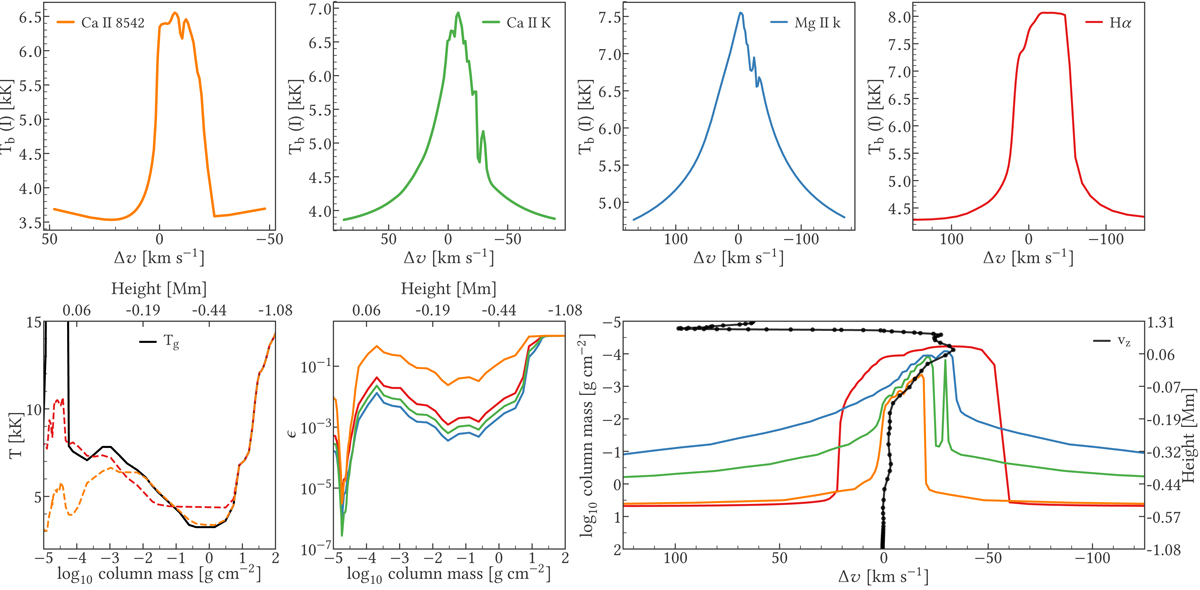
Line formation in a flare ribbon (orange cross in Fig. 6). Top row: profiles of vertically emergent intensity, expressed as brightness temperature Tb, as function of frequency from line center (in Doppler shift units) for Ca II 8542 Å (orange), Ca II K (green), Mg II k (blue), and Hα (red). Bottom left: line source functions for Hα (red dashed) and Ca II 8542 Å (orange dashed), expressed as excitation temperature, and the gas temperature (solid black) as a function of column mass. Bottom middle: photon destruction probabilities for each of the lines. Bottom right: height of optical depth unity (solid colored) and the vertical velocity (solid black dots indicate the grid points, upflow is positive) as a function of frequency from line center in Doppler shift units.
Current usage metrics show cumulative count of Article Views (full-text article views including HTML views, PDF and ePub downloads, according to the available data) and Abstracts Views on Vision4Press platform.
Data correspond to usage on the plateform after 2015. The current usage metrics is available 48-96 hours after online publication and is updated daily on week days.
Initial download of the metrics may take a while.