Fig. 11.
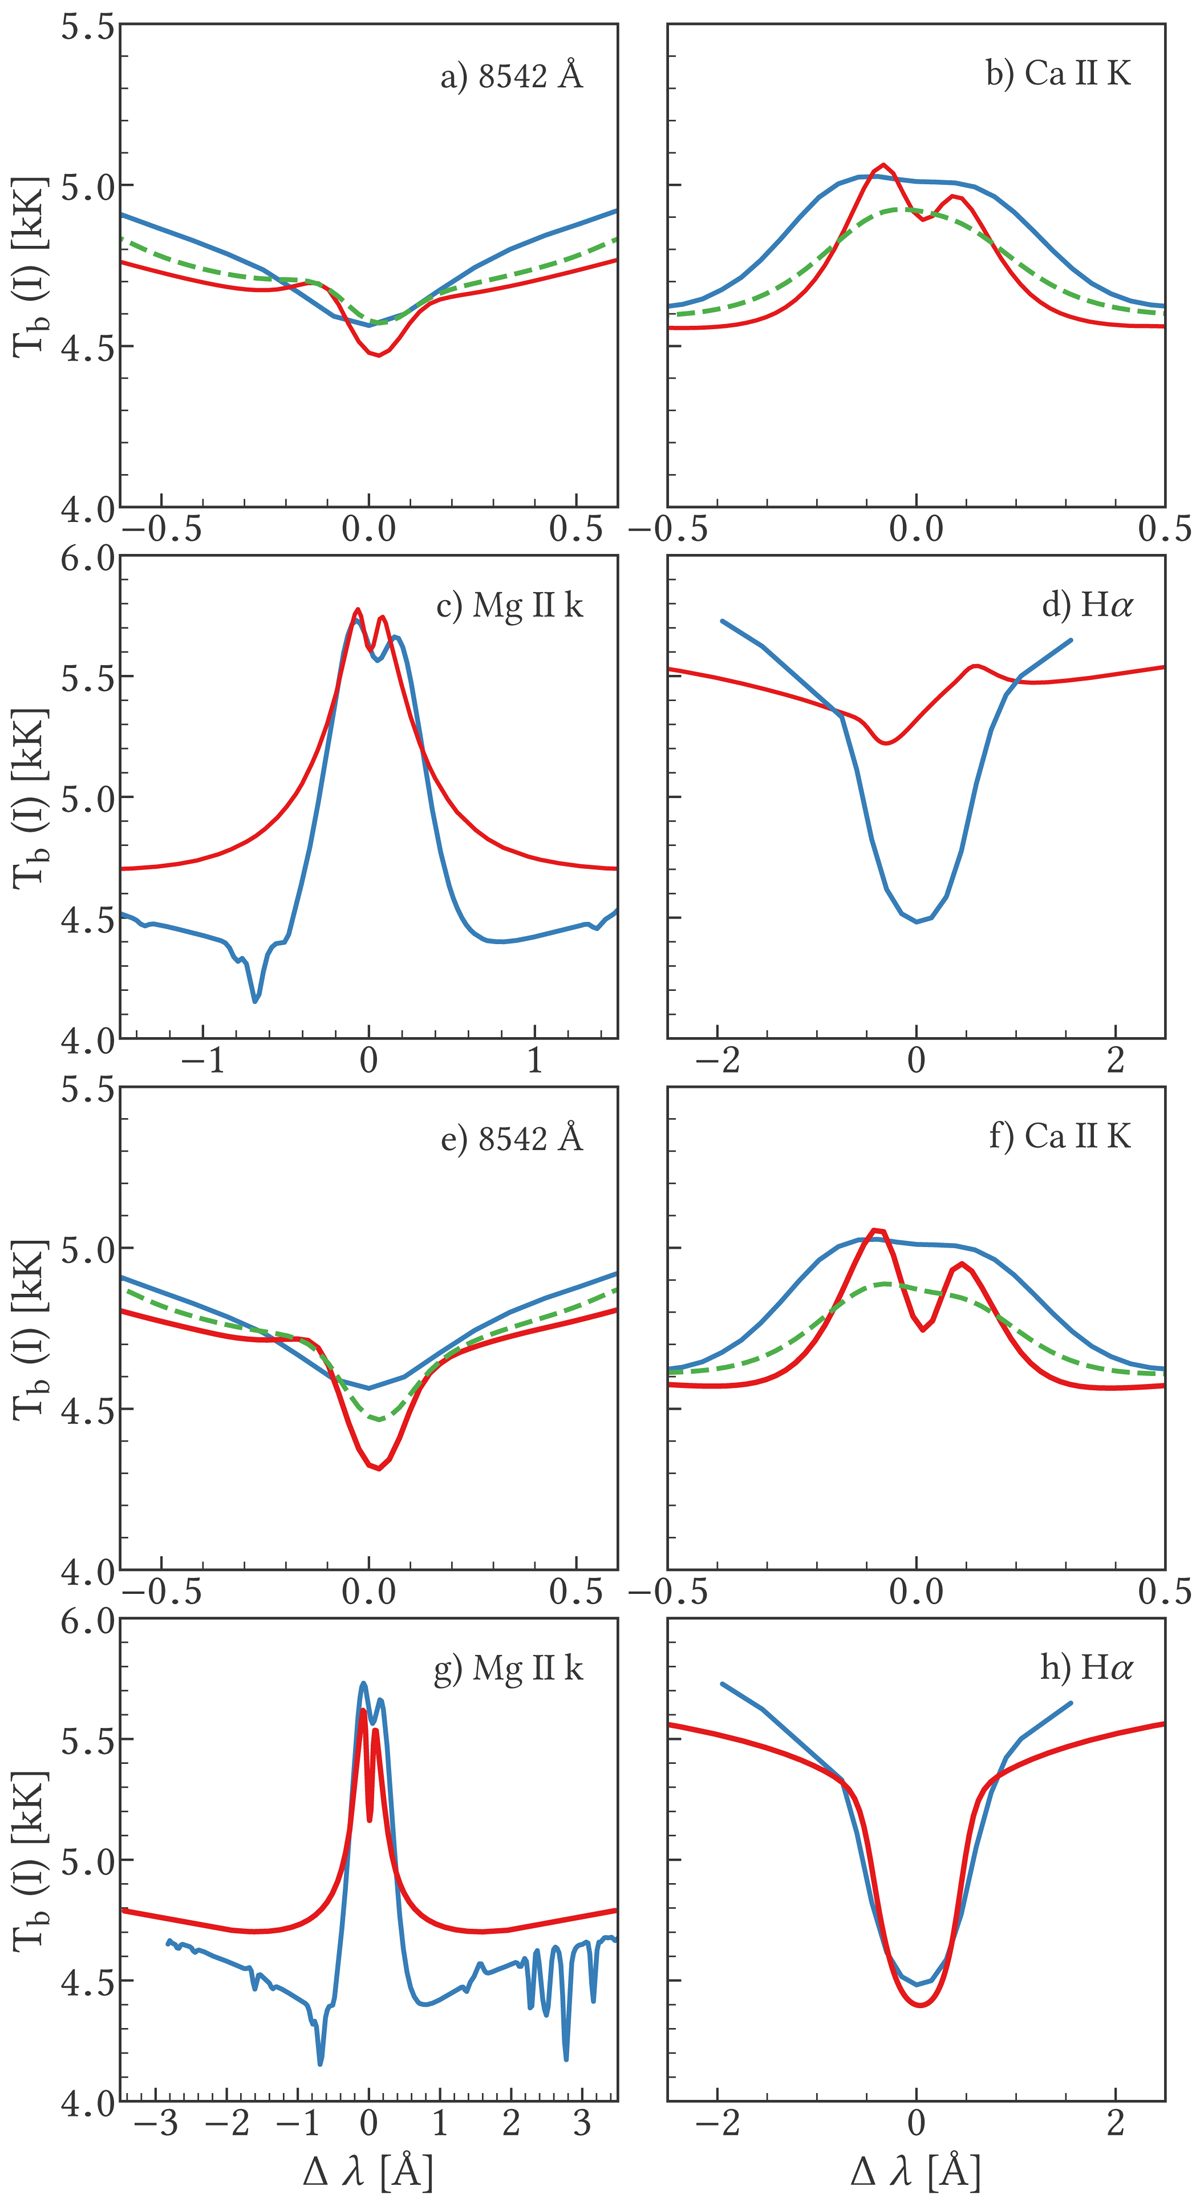
Spatially averaged line profiles of Ca II 8542 Å, Ca II K, Mg II k, and Hα expressed as brightness temperature Tb for the model atmosphere and our observations. Blue: observations; red: model atmosphere at full resolution; green dashed: model atmosphere spectrally degraded to match the resolution of the observations. Panels a–d: spatial averages for the entire model FOV. Panels e–h: spatial averages for a weakly magnetized patch only. The Hα and Mg II k lines are not degraded spectrally.
Current usage metrics show cumulative count of Article Views (full-text article views including HTML views, PDF and ePub downloads, according to the available data) and Abstracts Views on Vision4Press platform.
Data correspond to usage on the plateform after 2015. The current usage metrics is available 48-96 hours after online publication and is updated daily on week days.
Initial download of the metrics may take a while.