Fig. 10.
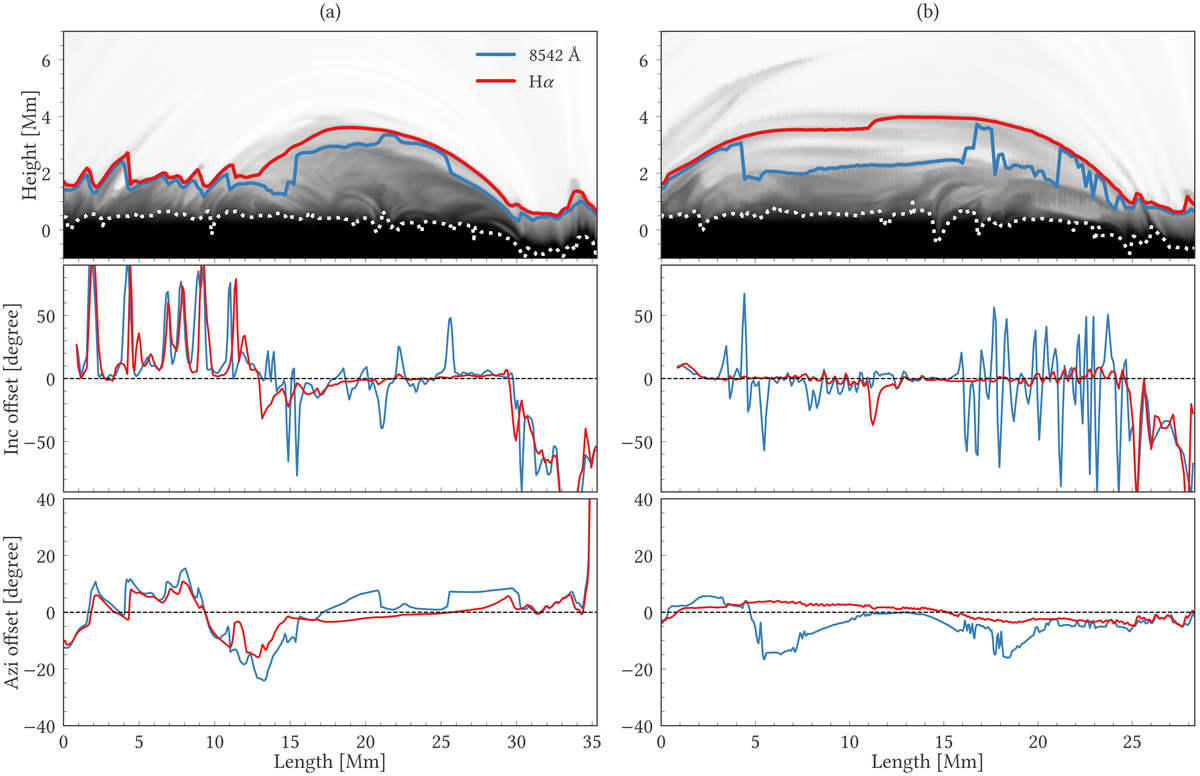
Alignment between the magnetic field vector and the curve of the maximum formation height at optical depth unity in two selected vertical slices. Left column: blue curve fibril in Fig. 8. Right column: red curve fibril in Fig. 8. Top row: formation heights of Hα (red) and Ca II 8542 Å (blue) with the β = 1 height (white dotted) layered over the mass density (grayscale background). Middle row: angle between the inclination of the magnetic field and the τ = 1 curve. Bottom row: angle between the magnetic field azimuth and the azimuth of the fibril.
Current usage metrics show cumulative count of Article Views (full-text article views including HTML views, PDF and ePub downloads, according to the available data) and Abstracts Views on Vision4Press platform.
Data correspond to usage on the plateform after 2015. The current usage metrics is available 48-96 hours after online publication and is updated daily on week days.
Initial download of the metrics may take a while.