Open Access
Fig. 6.
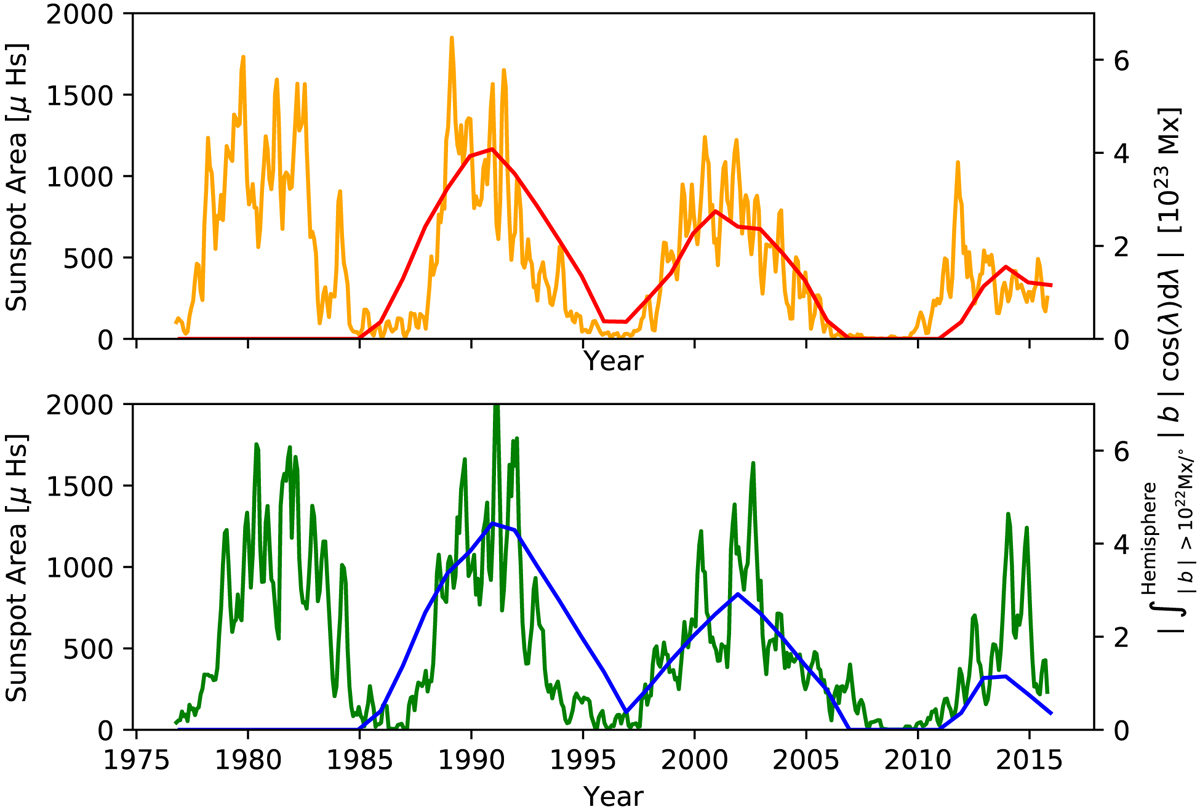
Sunspot coverage in northern (southern) hemisphere as function of time in orange (green). Also shown is the integral of the subsurface toroidal flux density in each hemisphere where it exceeds 1022 Mx deg−1.
Current usage metrics show cumulative count of Article Views (full-text article views including HTML views, PDF and ePub downloads, according to the available data) and Abstracts Views on Vision4Press platform.
Data correspond to usage on the plateform after 2015. The current usage metrics is available 48-96 hours after online publication and is updated daily on week days.
Initial download of the metrics may take a while.