Fig. 3.
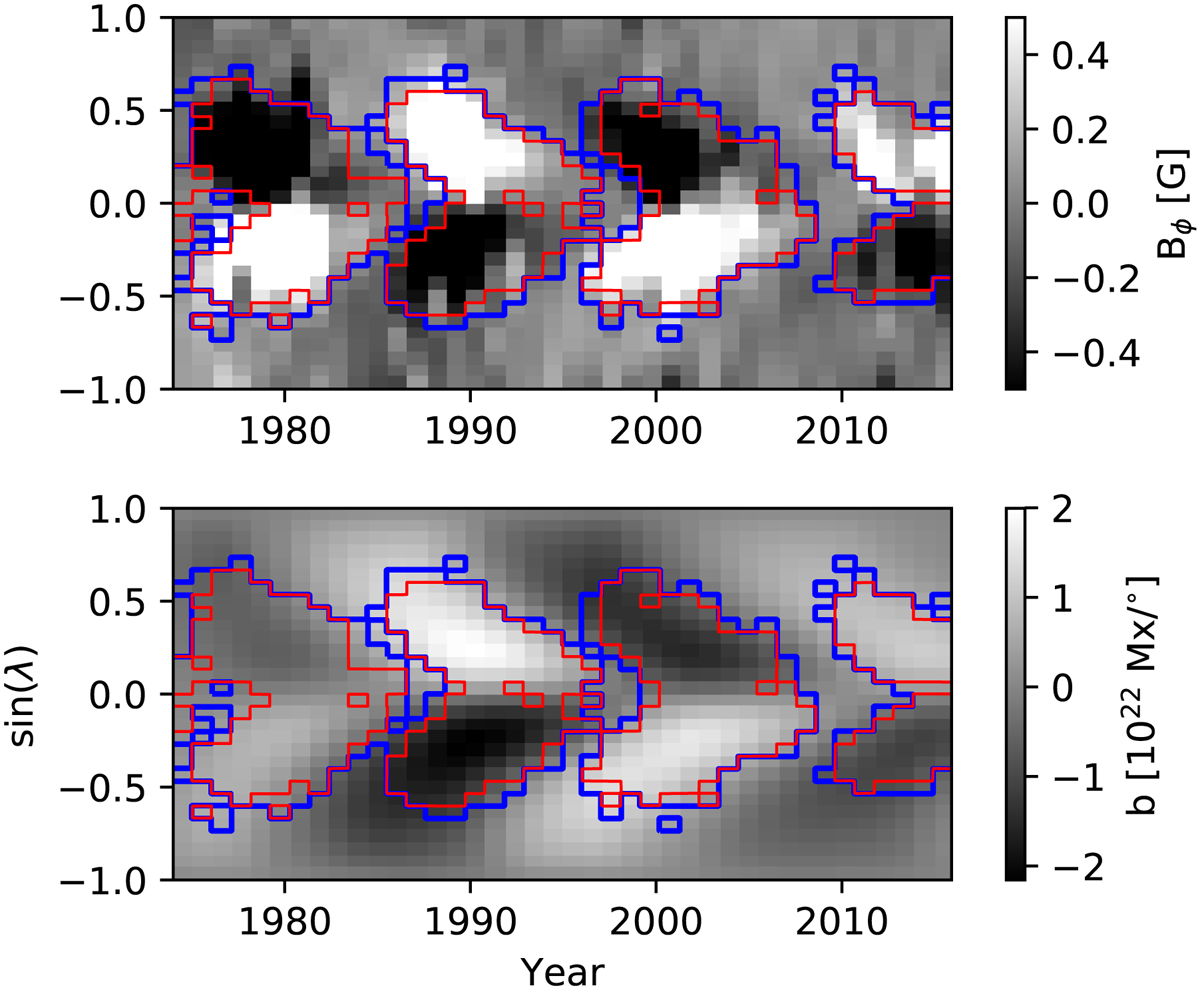
Upper panel: azimuthally averaged surface toroidal magnetic field (Bϕ) as a function time and latitude, saturated at ±0.5 G. The maps are inferred from WSO full-disk magnetograms as described in the text. The blue curve outlines the pixels (times and latitudes) where any sunspots were reported in the RGO and SOLIS sunspot records. The red curves outline the region where the average coverage by sunspots exceeds 0.1% micro Hemispheres over the pixel. Lower panel: subsurface toroidal flux density based on model and observed surface radial field. The red and blue curves are the same as in the upper panel. We use the interior of the red curve as the butterfly wings and the exterior of the blue contour as the quiet-Sun.
Current usage metrics show cumulative count of Article Views (full-text article views including HTML views, PDF and ePub downloads, according to the available data) and Abstracts Views on Vision4Press platform.
Data correspond to usage on the plateform after 2015. The current usage metrics is available 48-96 hours after online publication and is updated daily on week days.
Initial download of the metrics may take a while.