Fig. 2.
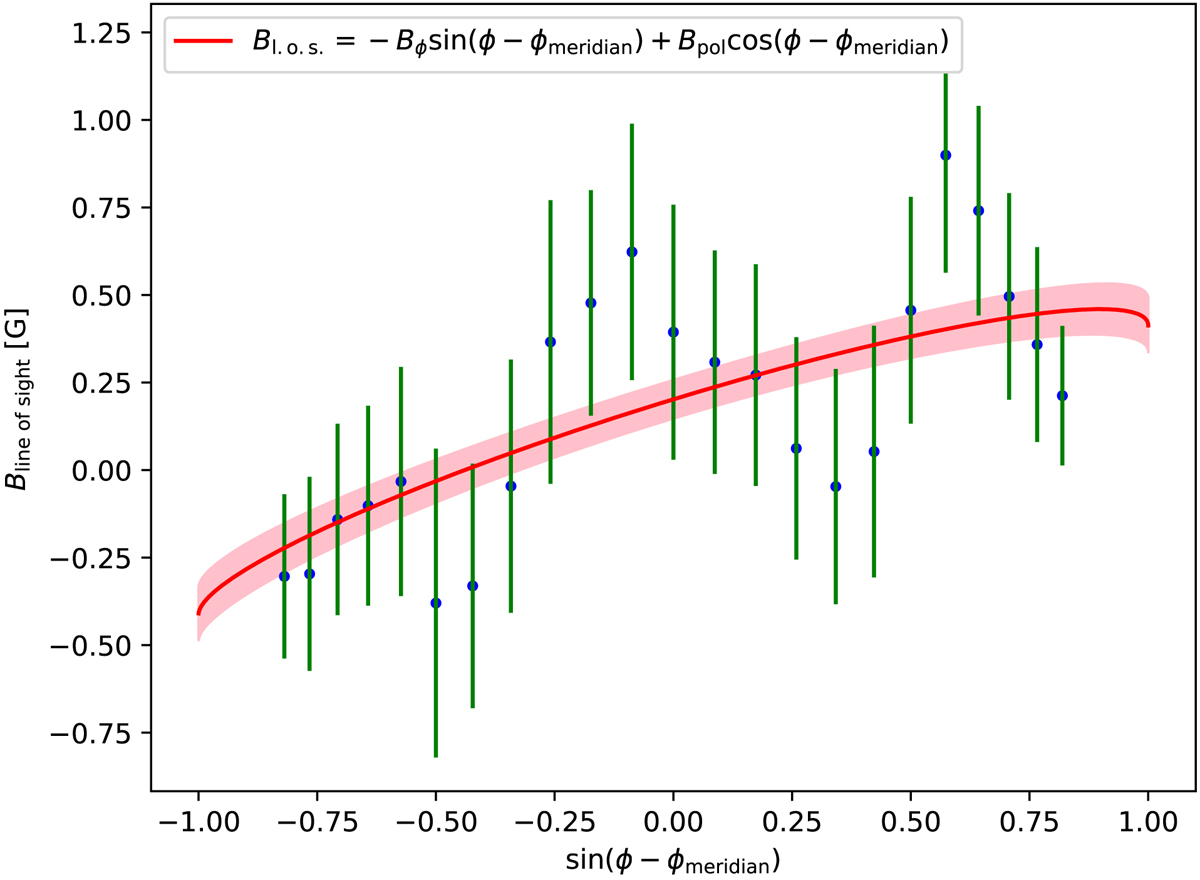
Yearly averaged (6 September 2015–5 September 2016) line-of-sight magnetic field at latitude −21° (blue dots). The green-curves show the error estimate based on the scatter in the daily value going into the 12-month averaging. The red curve shows the fit Bl.o.s. = −Bϕsin(ϕ − ϕmeridian)+Bpolcos(ϕ − ϕmeridian), and the pink shaded region shows the 1-σ error estimates for the parameter fits.
Current usage metrics show cumulative count of Article Views (full-text article views including HTML views, PDF and ePub downloads, according to the available data) and Abstracts Views on Vision4Press platform.
Data correspond to usage on the plateform after 2015. The current usage metrics is available 48-96 hours after online publication and is updated daily on week days.
Initial download of the metrics may take a while.