Fig. A.1.
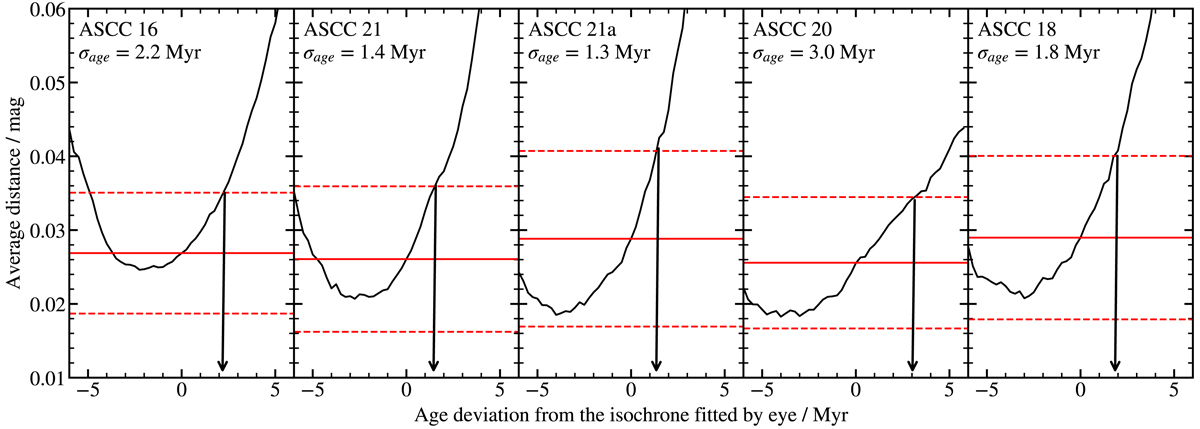
Derivation of age uncertainties. Black line shows average distance between all cluster members and an isochrone at a given age as measured on an HR diagram. Red horizontal lines show the average distance at our claimed age (solid line) and 1σ scatter of distances from the isochrone fitted by eye (dashed line). Age difference at which the average distance reaches the top dashed line is 1σ uncertainty for the age of each cluster. The calculated uncertainty is marked by an arrow. Note that such analysis is highly impacted by binaries and biases, so the described procedure is only reliable for positive age deviations.
Current usage metrics show cumulative count of Article Views (full-text article views including HTML views, PDF and ePub downloads, according to the available data) and Abstracts Views on Vision4Press platform.
Data correspond to usage on the plateform after 2015. The current usage metrics is available 48-96 hours after online publication and is updated daily on week days.
Initial download of the metrics may take a while.