Fig. 3.
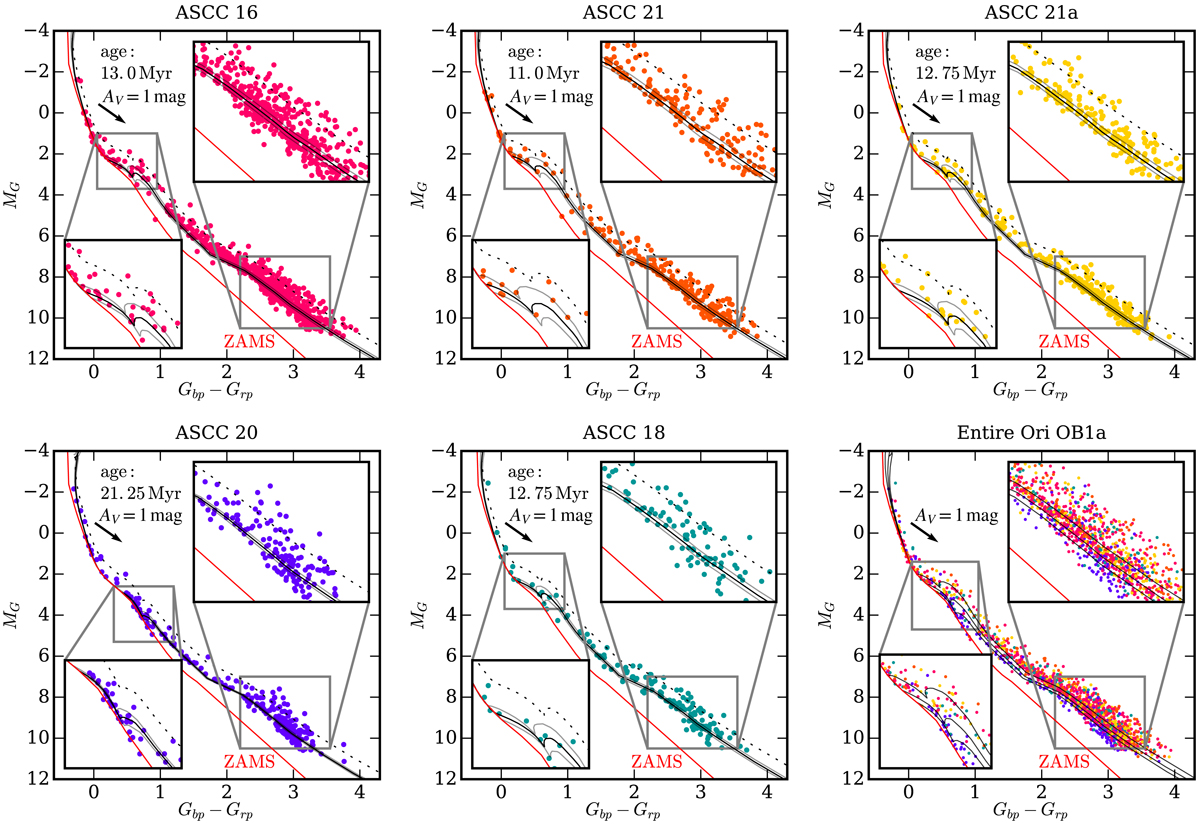
Isochrones fitted to the Gaia DR2 HR diagrams. Each panel shows one group in Ori OB1a. Solid lines are the best matching isochrones. Dashed lines are the isochrones for the binary sequence (for stars of equal luminosities). The age of the best matching isochrone is written in each panel. Isochrones for ±2 Myr are plotted in gray. The zero-age-main-sequence is plotted in red. For all five groups we assumed the same metallicity ([M/H] = 0.03) and extinction (AV = 0.25). Zoomed insets show the regions most suitable for age determination. The last panel shows all five clusters together with isochrones for 10, 15, and 20 Myr. The arrow on each plot shows a reddening vector at AV = 1 mag. See also an online animation showing the comparison of the HR diagrams. Note that the darkest stars plotted here at G ∼ 17.5 are bright enough to be unaffected by background subtraction issues in Gaia DR2.
Current usage metrics show cumulative count of Article Views (full-text article views including HTML views, PDF and ePub downloads, according to the available data) and Abstracts Views on Vision4Press platform.
Data correspond to usage on the plateform after 2015. The current usage metrics is available 48-96 hours after online publication and is updated daily on week days.
Initial download of the metrics may take a while.