Fig. 2.
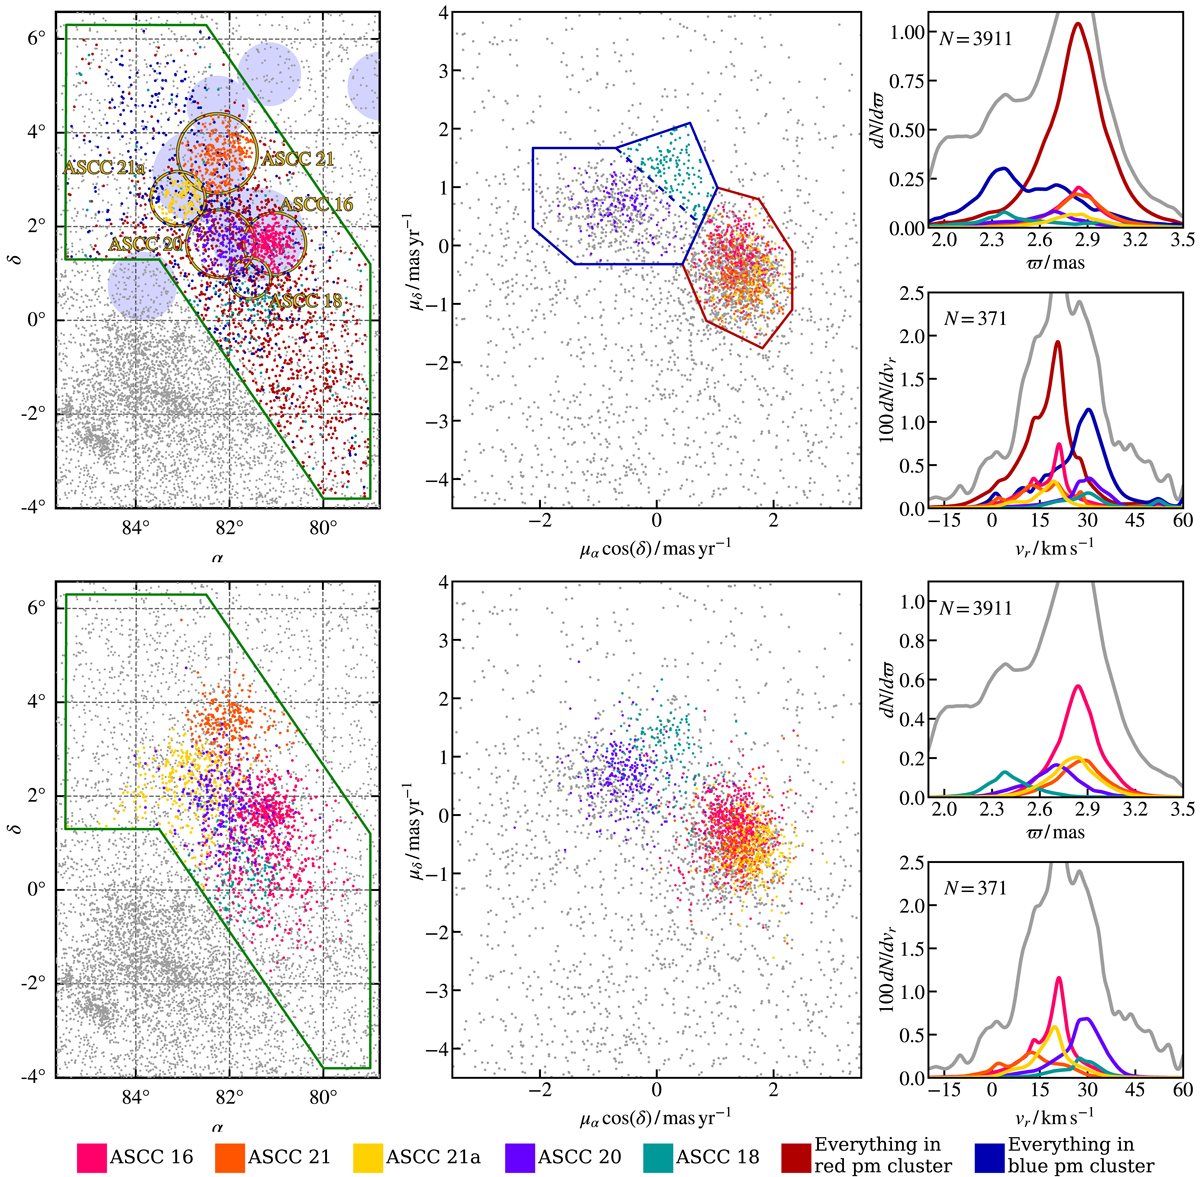
Clustering of Ori OB1a. Top panels: initial heuristic clusters and bottom panels show the final clustering. Left: star map of the association. Only stars between −3.5 < μαcos(δ) < 3.5 mas yr−1, −4.5 < μδ < 4 mas yr−1, and 1.9 < ϖ < 3.5 mas are plotted. Yellow circles mark associations in Kharchenko et al. (2013). The circle marked as ASCC 21a was added by us. Blue filled circles mark fields observed in the GALAH survey. Middle: proper motion plane. Only stars inside the green polygon from the left-hand panel are plotted. Red and blue polygons mark two distinct proper motion groups that we use in heuristic clustering. Top-right: distribution of stars’ parallaxes inside the green polygon (grey line). Bottom-right: distribution of stars’ radial velocities inside the green polygon (grey line). Only a fraction of stars have radial velocity measured in Gaia DR2. For stars observed in the GALAH and APOGEE surveys, we use the radial velocities measured by them. Distributions for individual groups are shown with the matching colours.
Current usage metrics show cumulative count of Article Views (full-text article views including HTML views, PDF and ePub downloads, according to the available data) and Abstracts Views on Vision4Press platform.
Data correspond to usage on the plateform after 2015. The current usage metrics is available 48-96 hours after online publication and is updated daily on week days.
Initial download of the metrics may take a while.