Fig. 1.
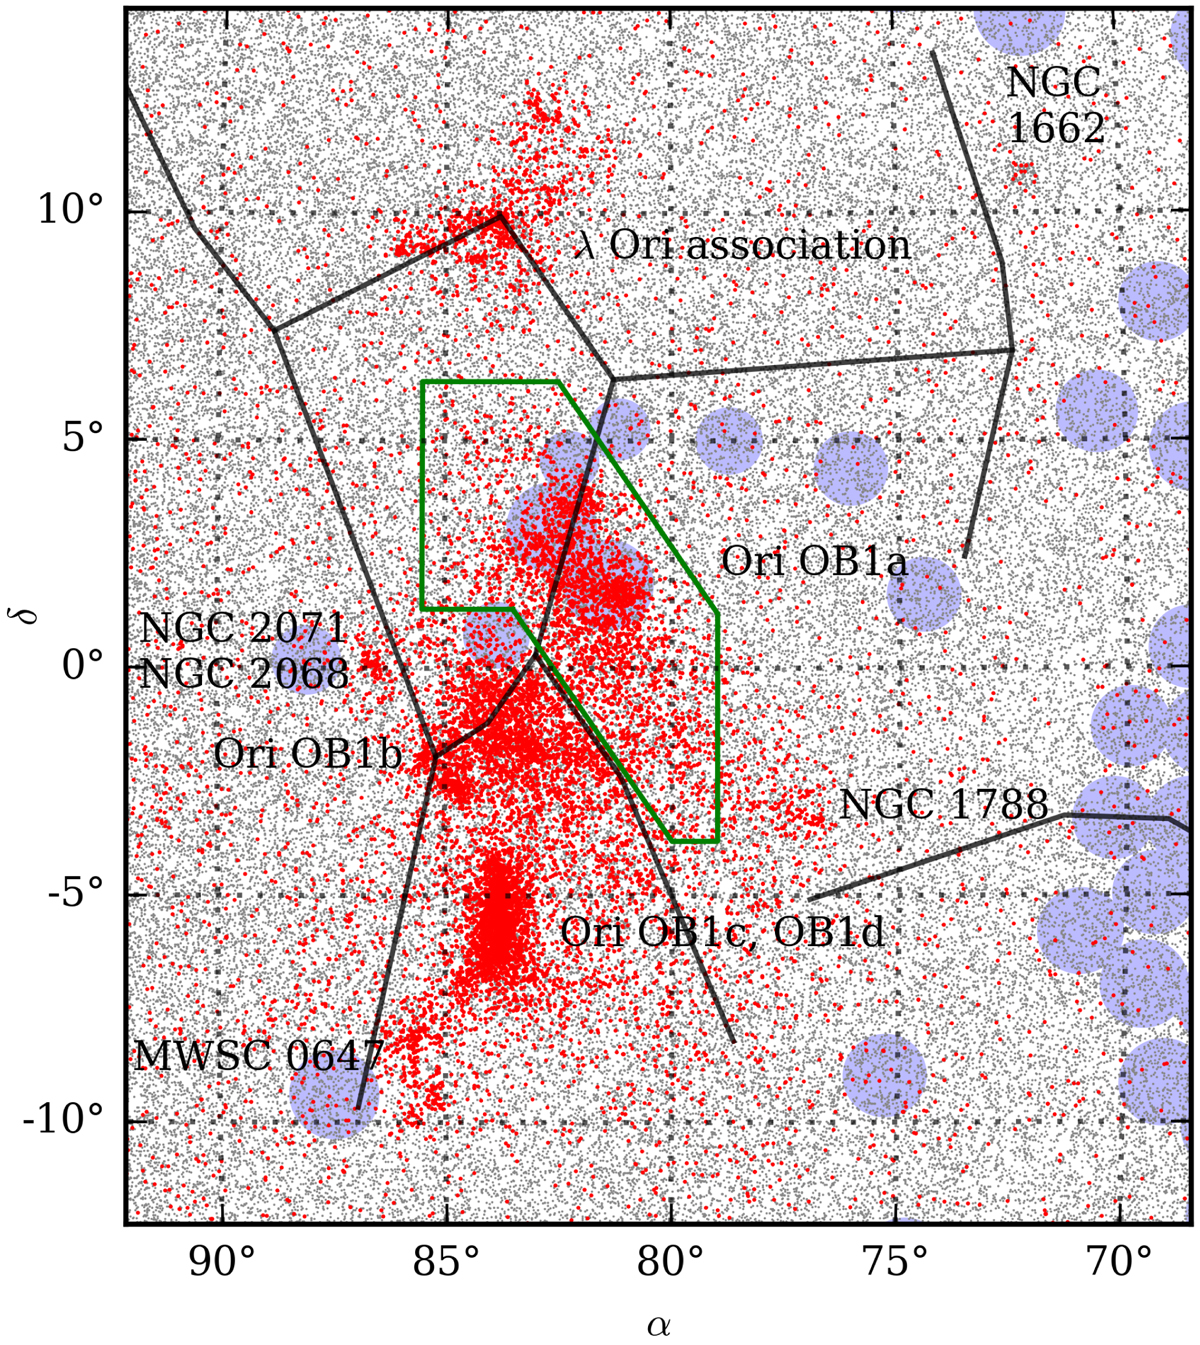
Star map of the Orion complex. Gaia DR2 stars in the Ori OB1 distance range (1.9 < ϖ < 3.5 mas) are plotted in grey. Stars that also share Ori OB1’s proper motions (−3.5 < μ < 3.5 mas yr−1 for both components) are plotted in red. There are four main OB associations in Orion: λ Ori association is centred on the star of the same name. Just above Orion’s belt is Ori OB1a, in Orion’s belt is Ori OB1b, around the Orion nebula is Ori OB1c and the stars in the centre of the nebula form Ori OB1d. Some open and embedded clusters associated with the complex are also marked. Fields observed in the GALAH survey are marked with blue circles. The Ori OB1a region as used in this paper is marked with a green polygon. Black lines show the constellations Orion and Eridanus.
Current usage metrics show cumulative count of Article Views (full-text article views including HTML views, PDF and ePub downloads, according to the available data) and Abstracts Views on Vision4Press platform.
Data correspond to usage on the plateform after 2015. The current usage metrics is available 48-96 hours after online publication and is updated daily on week days.
Initial download of the metrics may take a while.