Fig. 8.
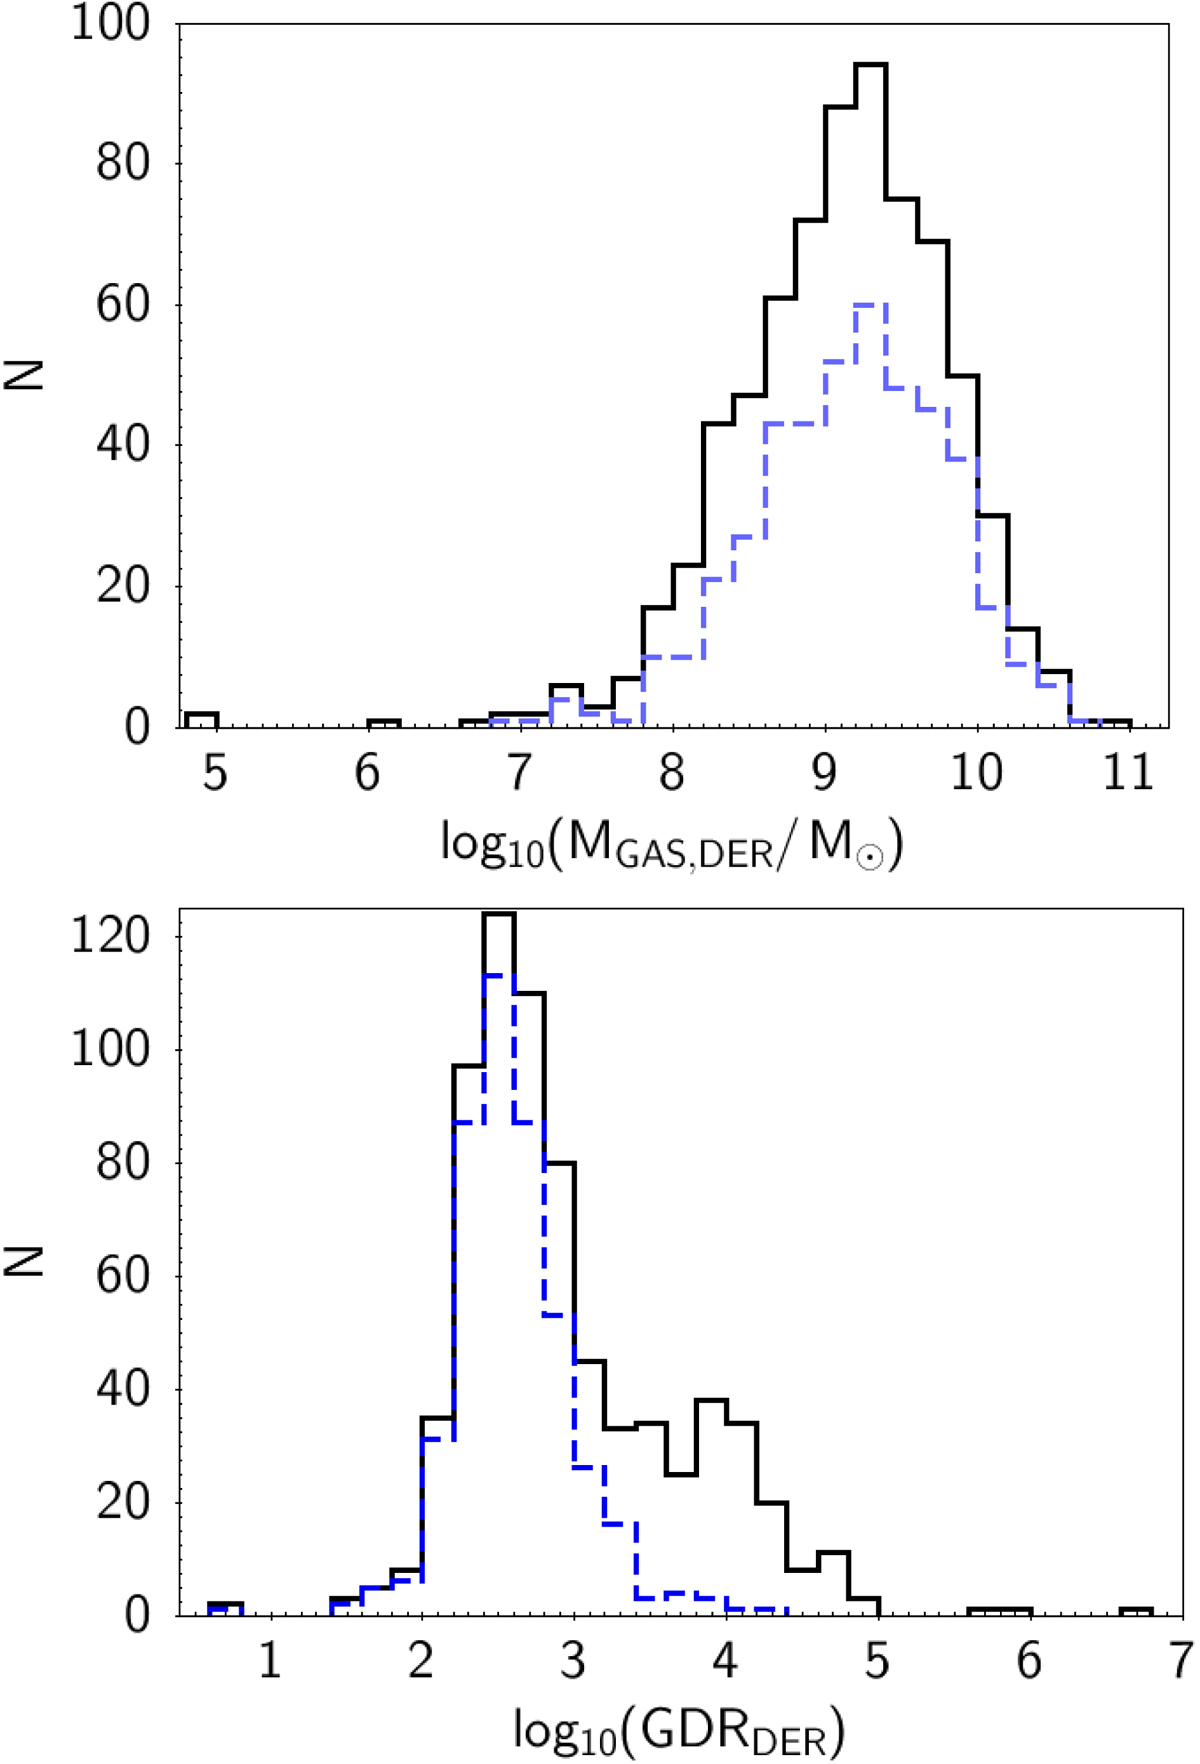
Upper panel: distribution function of the derived gas mass, MGAS, DER, assuming an extended KS law to hold. The blue dotted histogram shows the MGAS, DER for the LTGs and Irs, while the black solid line shows the derived MGAS, DER for all galaxies, assuming that the ETGs also follow the same Eq. (7), defined by the LTGs and Irs. Lower panel: distribution function of the GDRDER, assuming an extended KS law to hold. The dotted blue and solid black histograms are defined in the same way as in the upper panel.
Current usage metrics show cumulative count of Article Views (full-text article views including HTML views, PDF and ePub downloads, according to the available data) and Abstracts Views on Vision4Press platform.
Data correspond to usage on the plateform after 2015. The current usage metrics is available 48-96 hours after online publication and is updated daily on week days.
Initial download of the metrics may take a while.