Fig. 6.
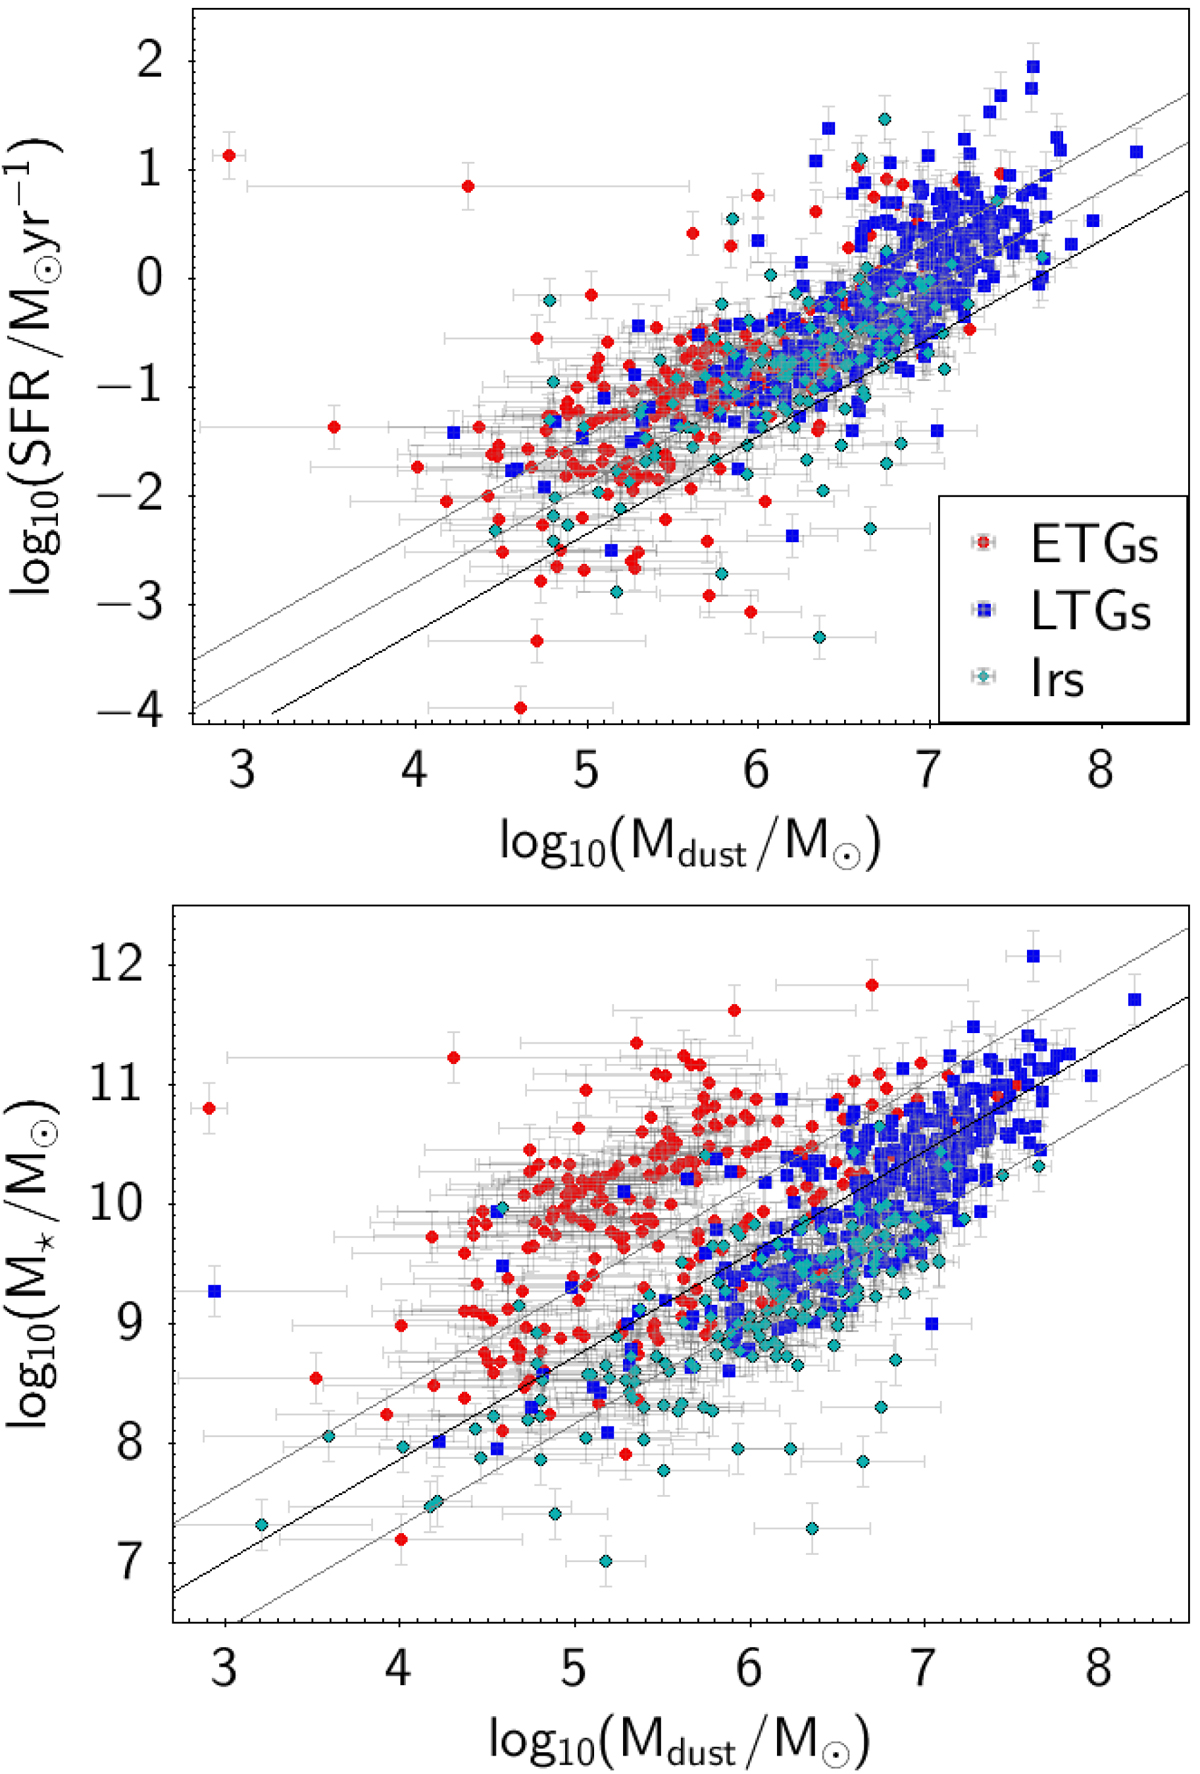
SFR versus Mdust (upper panel), and M⋆ with Mdust (lower panel). ETGs are shown with red symbols, late-type galaxies are shown with blue symbols, and irregulars are shown with light blue symbols. The error bars represent the standard deviation for the Mdust, and the propagated uncertainty (photometric and calibration) for the SFR and M⋆. The black solid line in the upper panel is the relation found by da Cunha et al. (2010) along with the intrinsic scatter of the relation. The black solid line in the lower panel is the relation between Mdust and M⋆, along with the ±1-σ intrinsic scatter.
Current usage metrics show cumulative count of Article Views (full-text article views including HTML views, PDF and ePub downloads, according to the available data) and Abstracts Views on Vision4Press platform.
Data correspond to usage on the plateform after 2015. The current usage metrics is available 48-96 hours after online publication and is updated daily on week days.
Initial download of the metrics may take a while.