Free Access
Fig. 5.
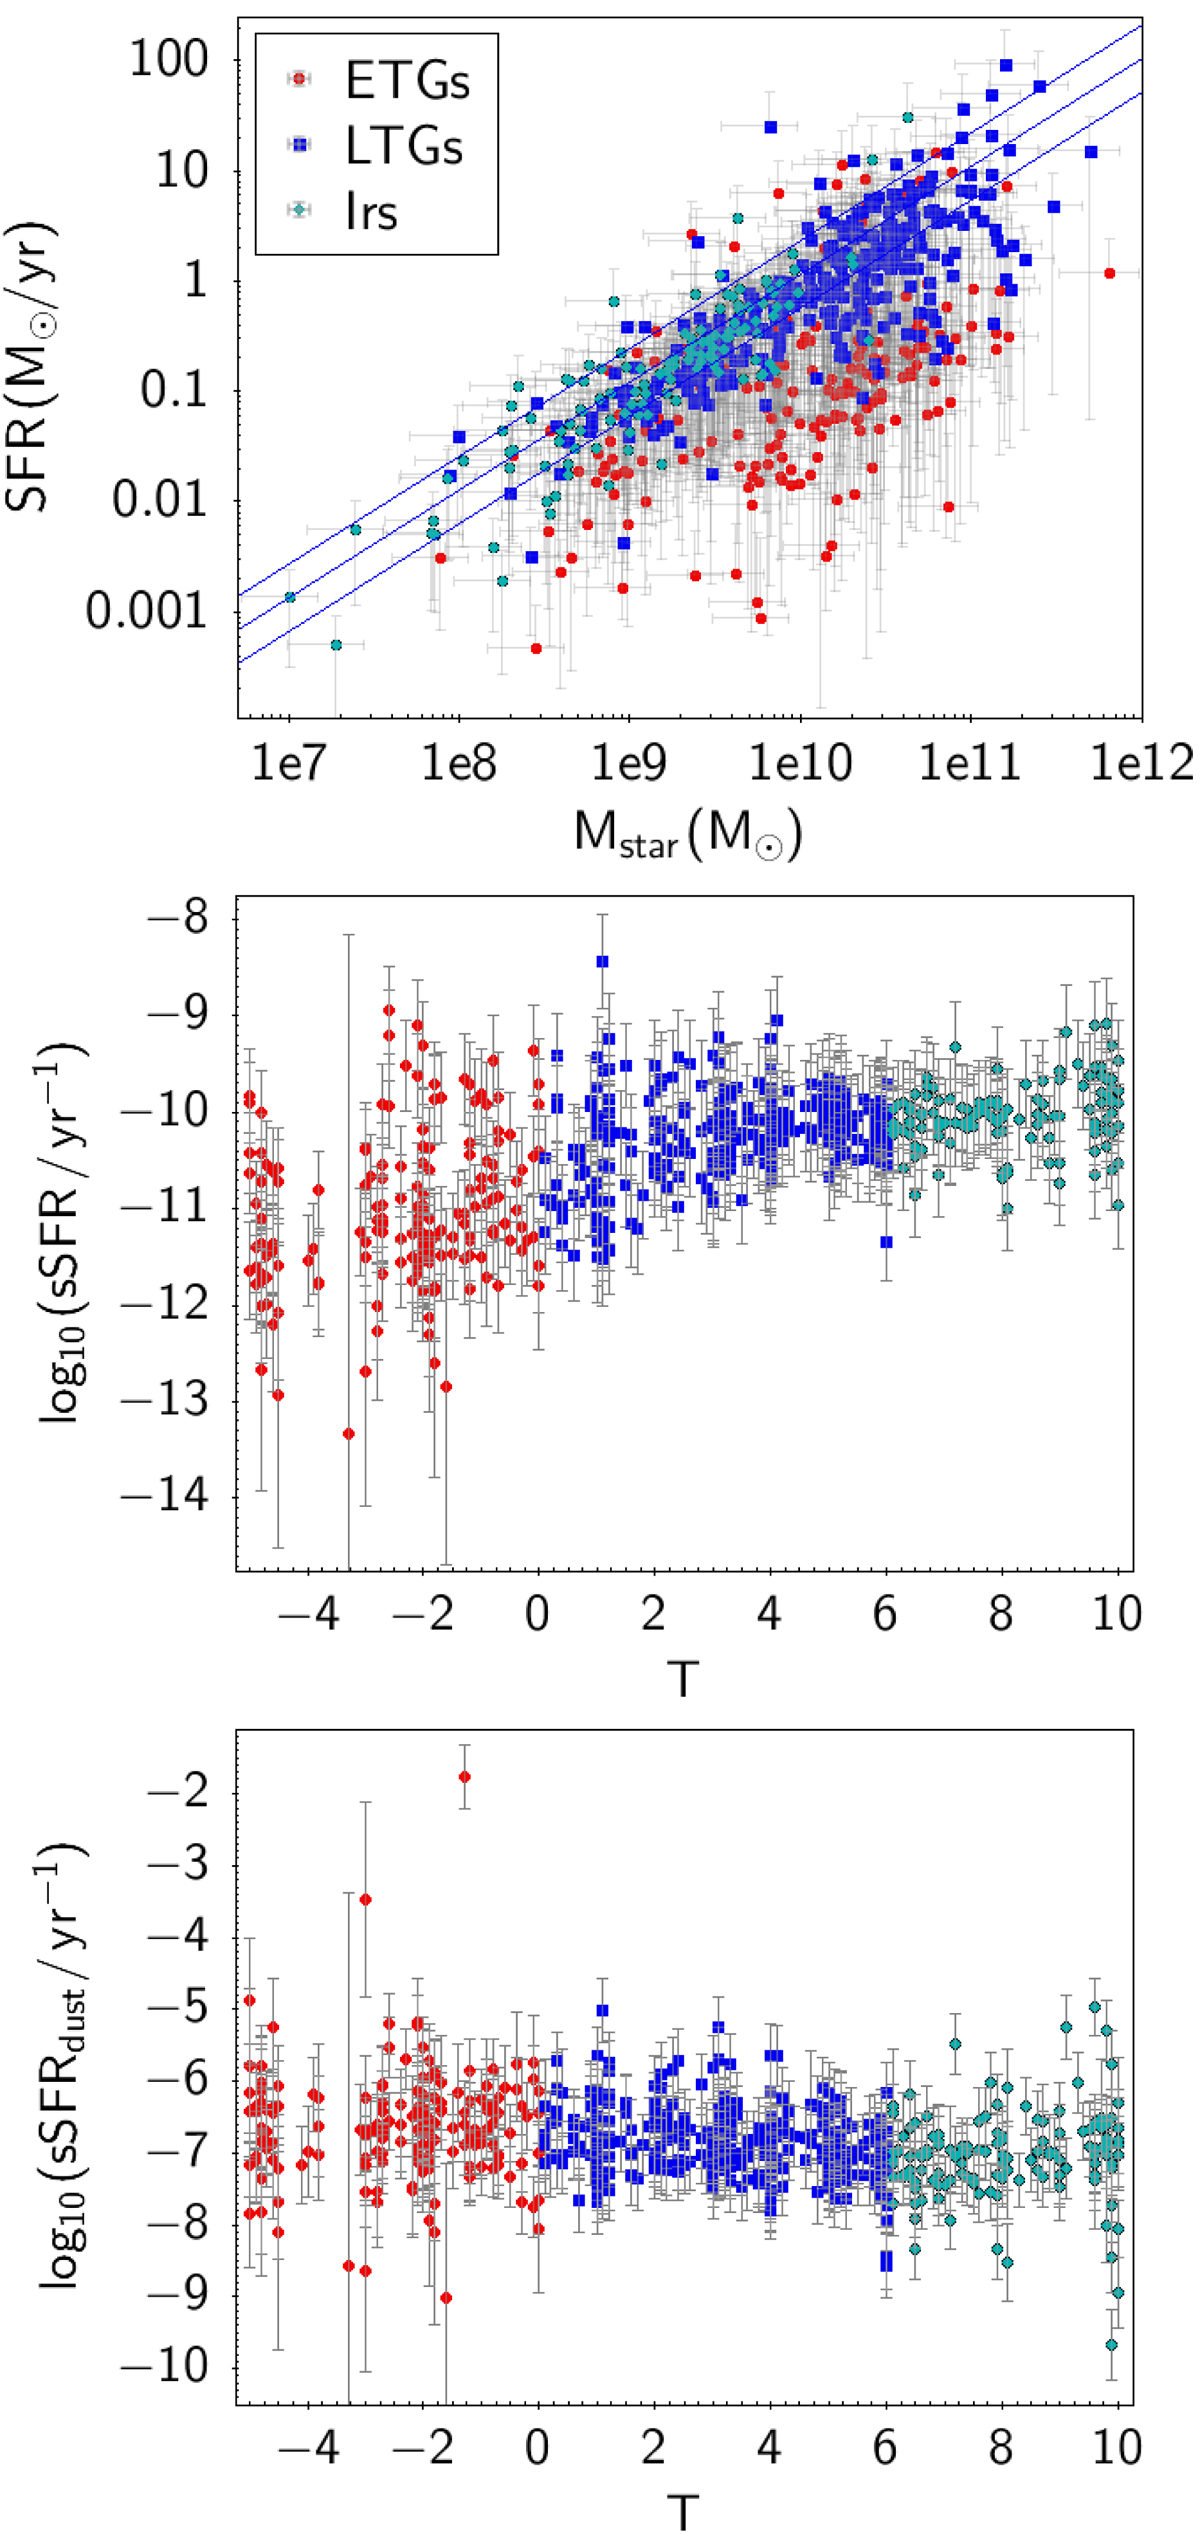
Upper panel: SFR as a function of the stellar mass. The blue line shows a fit to the LTGs and Irs, along with the lines with ±0.3 dex scatter in the y-axis. Middle panel: specific star formation rate, sSFR, versus galaxy type. Lower panel: dust-sSFR, sSFRdust, versus galaxy type.
Current usage metrics show cumulative count of Article Views (full-text article views including HTML views, PDF and ePub downloads, according to the available data) and Abstracts Views on Vision4Press platform.
Data correspond to usage on the plateform after 2015. The current usage metrics is available 48-96 hours after online publication and is updated daily on week days.
Initial download of the metrics may take a while.