Fig. 3.
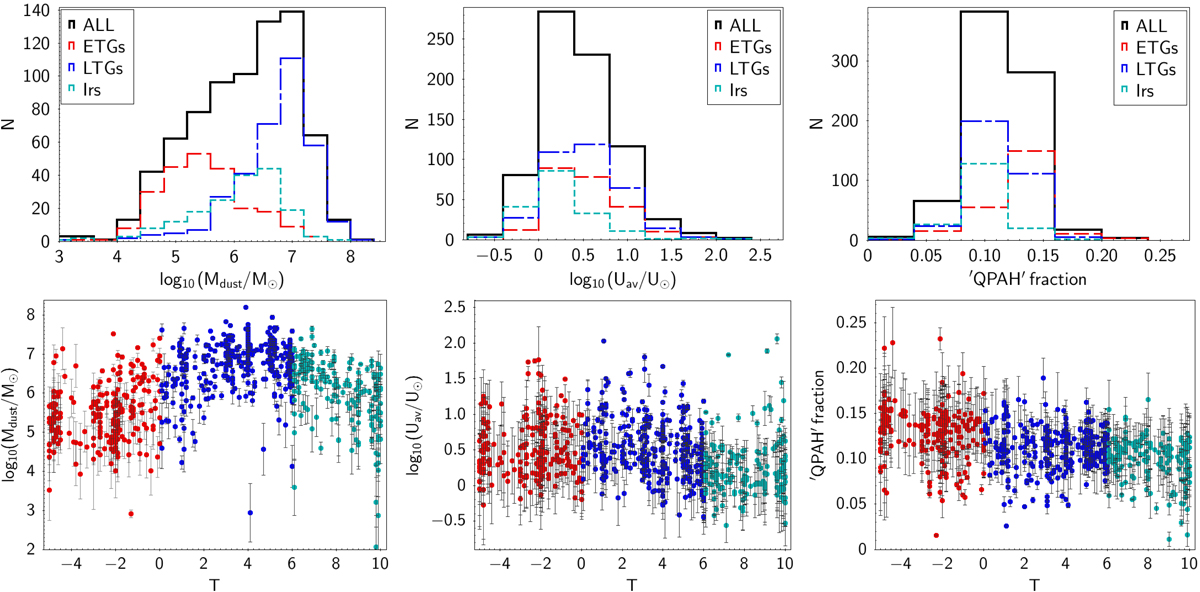
Upper panels: distribution functions of the derived properties for the ensemble (black histogram) and per galaxy type (coloured histograms). Lower panels: distribution of derived properties as a function of galaxy type. In all panels, dust masses are shown in the left panels, average ISRF intensities are shown in the middle panels, and “QPAH” fraction in the right panels.
Current usage metrics show cumulative count of Article Views (full-text article views including HTML views, PDF and ePub downloads, according to the available data) and Abstracts Views on Vision4Press platform.
Data correspond to usage on the plateform after 2015. The current usage metrics is available 48-96 hours after online publication and is updated daily on week days.
Initial download of the metrics may take a while.