Fig. A.3.
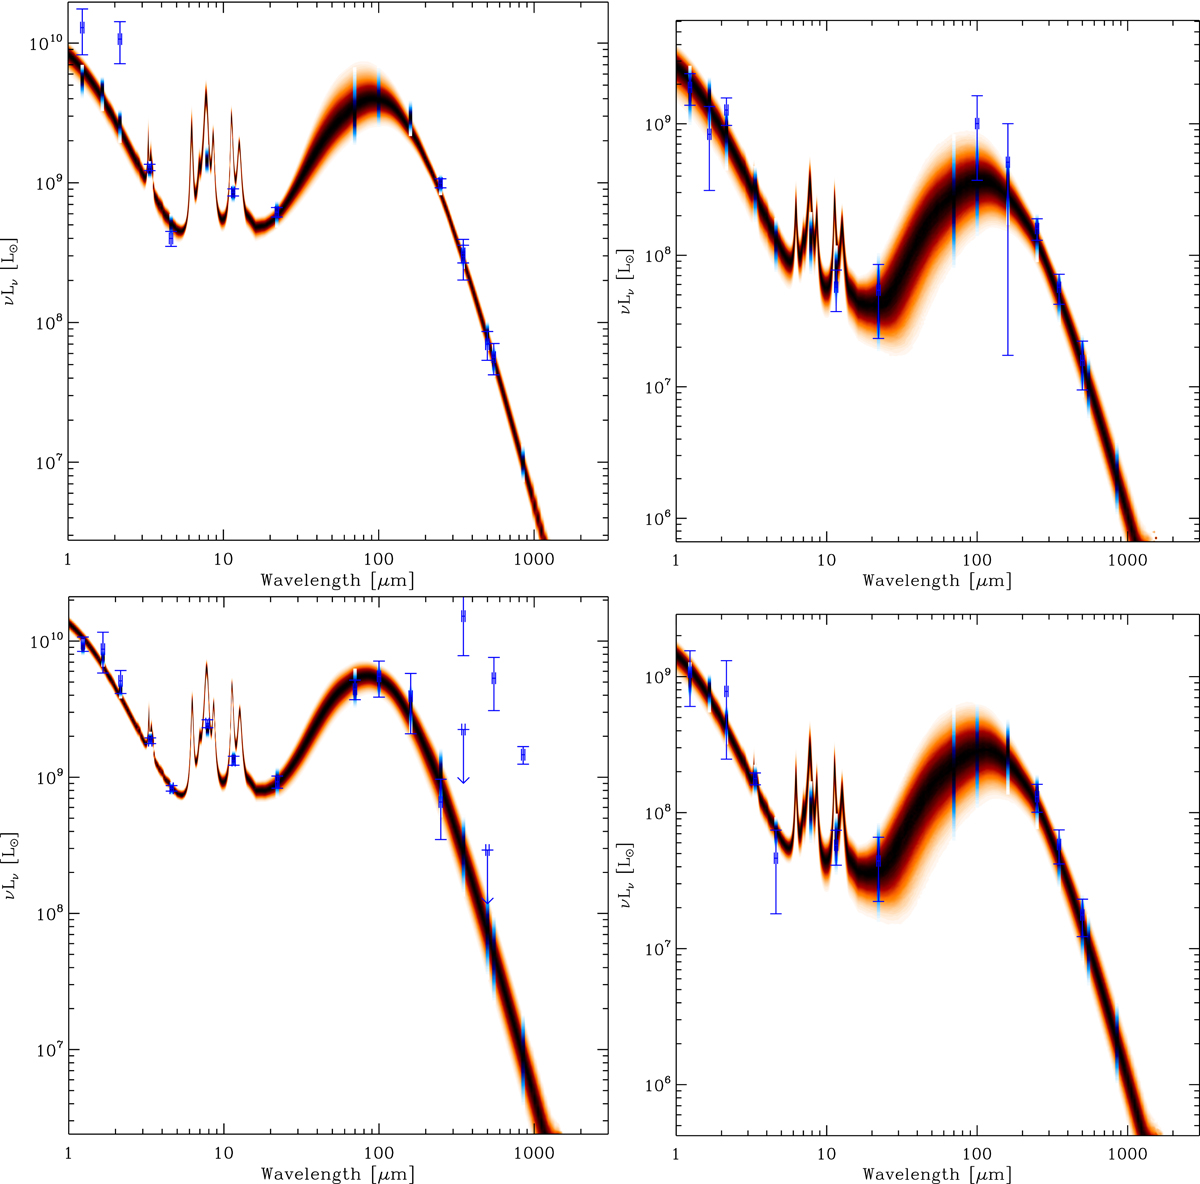
Dust-SEDs of selected individual galaxies in our sample. The observed data points are marked with the blue symbols, along with the uncertainty, while the model dust-SEDs are shown with the red, which represent the model dust-SEDs after each of the MCMC simulations performed. The blue-black shaded vertical symbols correspond to the synthetic photometry. The galaxies shown are NGC 3485 (upper left), NGC 4629 (upper right), UGC 12160 (lower left), and UGC 12709 (lower right).
Current usage metrics show cumulative count of Article Views (full-text article views including HTML views, PDF and ePub downloads, according to the available data) and Abstracts Views on Vision4Press platform.
Data correspond to usage on the plateform after 2015. The current usage metrics is available 48-96 hours after online publication and is updated daily on week days.
Initial download of the metrics may take a while.