Fig. A.1
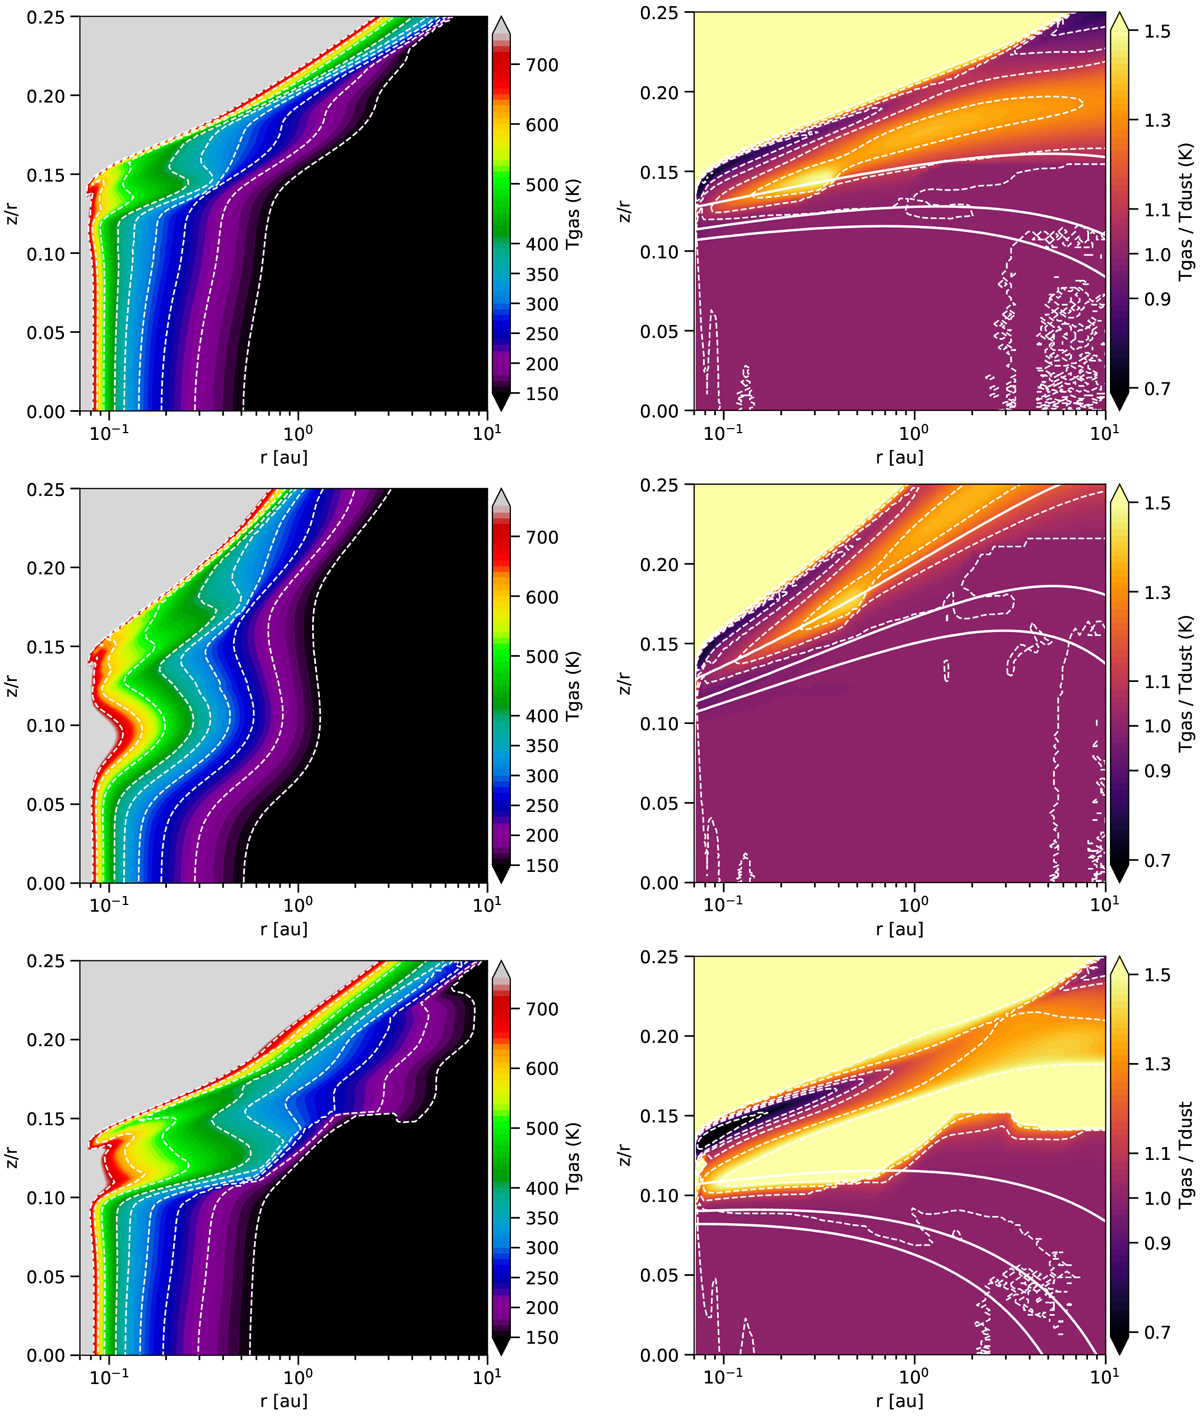
Upper left panel: gas temperature of the standard T Tauri model. Upper right panel: ratio of gas temperature to dust temperature. Middle two panels: same, but for the “flaring high” model. Bottom: “lessdust” model. The colour scheme in the left-hand panels is made to exaggerate small differences.The dashed white contour lines correspond to the temperature labels on the colour bar, in the same manner as Fig. 2. The solid white contours indicate vertical optical depths AV = 1, 5, and 10.
Current usage metrics show cumulative count of Article Views (full-text article views including HTML views, PDF and ePub downloads, according to the available data) and Abstracts Views on Vision4Press platform.
Data correspond to usage on the plateform after 2015. The current usage metrics is available 48-96 hours after online publication and is updated daily on week days.
Initial download of the metrics may take a while.