Fig. 3.
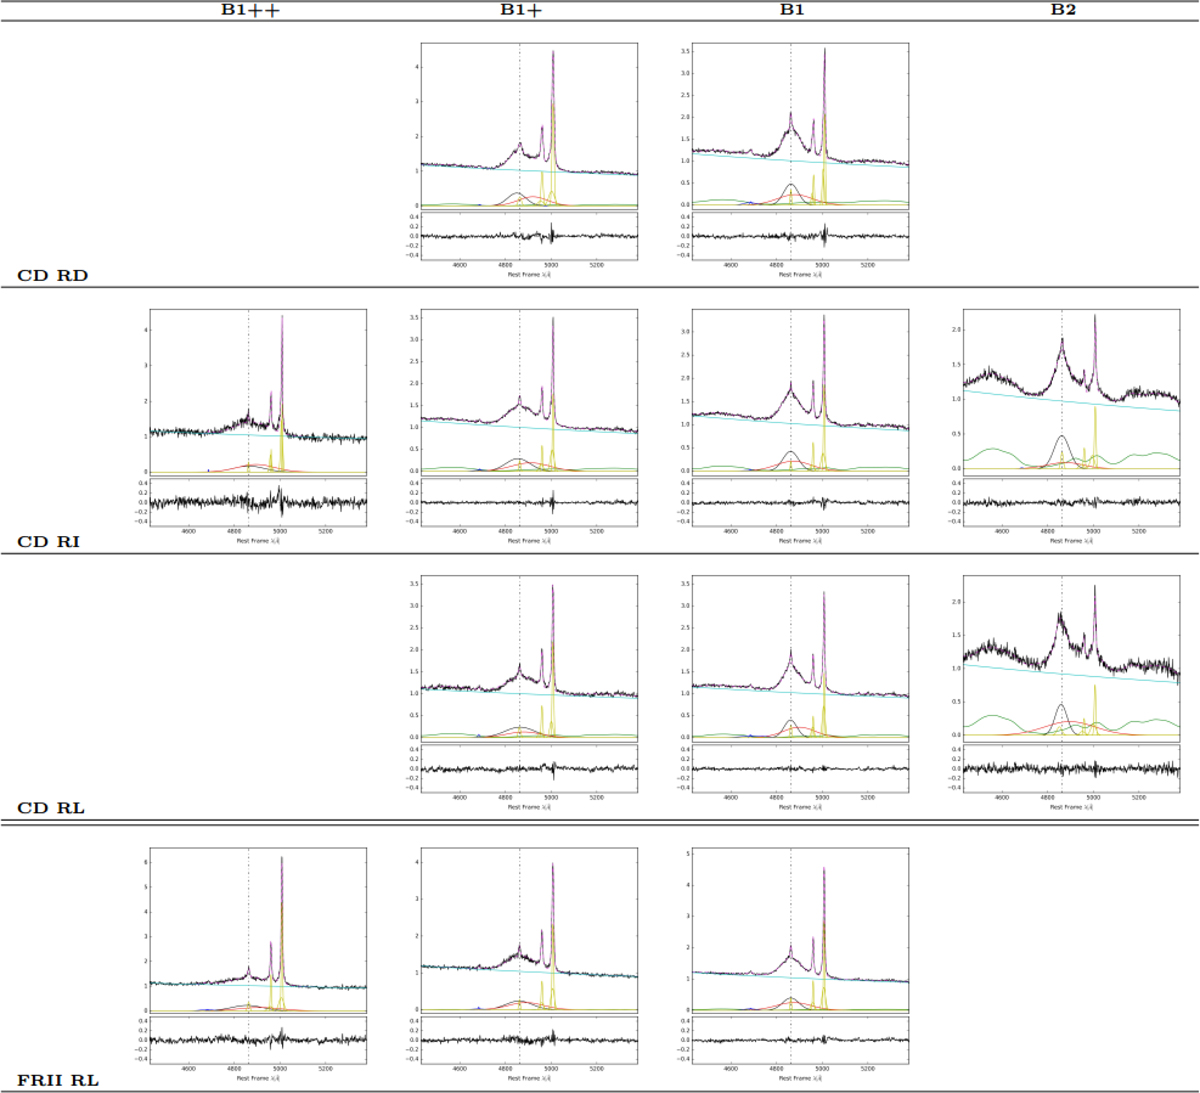
Composite of STs along MS, ordered from B1++ to B2. Each panel shows the original composite, along with the modeled continuum (cyan line). The lower part of the panels shows the result of the specfit analysis on the emission lines. HβBC: black line, HβVBC: red line; Fe II: green line; yellow lines: Hβ narrow components and [O III]λλ4959,5007.
Current usage metrics show cumulative count of Article Views (full-text article views including HTML views, PDF and ePub downloads, according to the available data) and Abstracts Views on Vision4Press platform.
Data correspond to usage on the plateform after 2015. The current usage metrics is available 48-96 hours after online publication and is updated daily on week days.
Initial download of the metrics may take a while.