Free Access
Fig. 2.
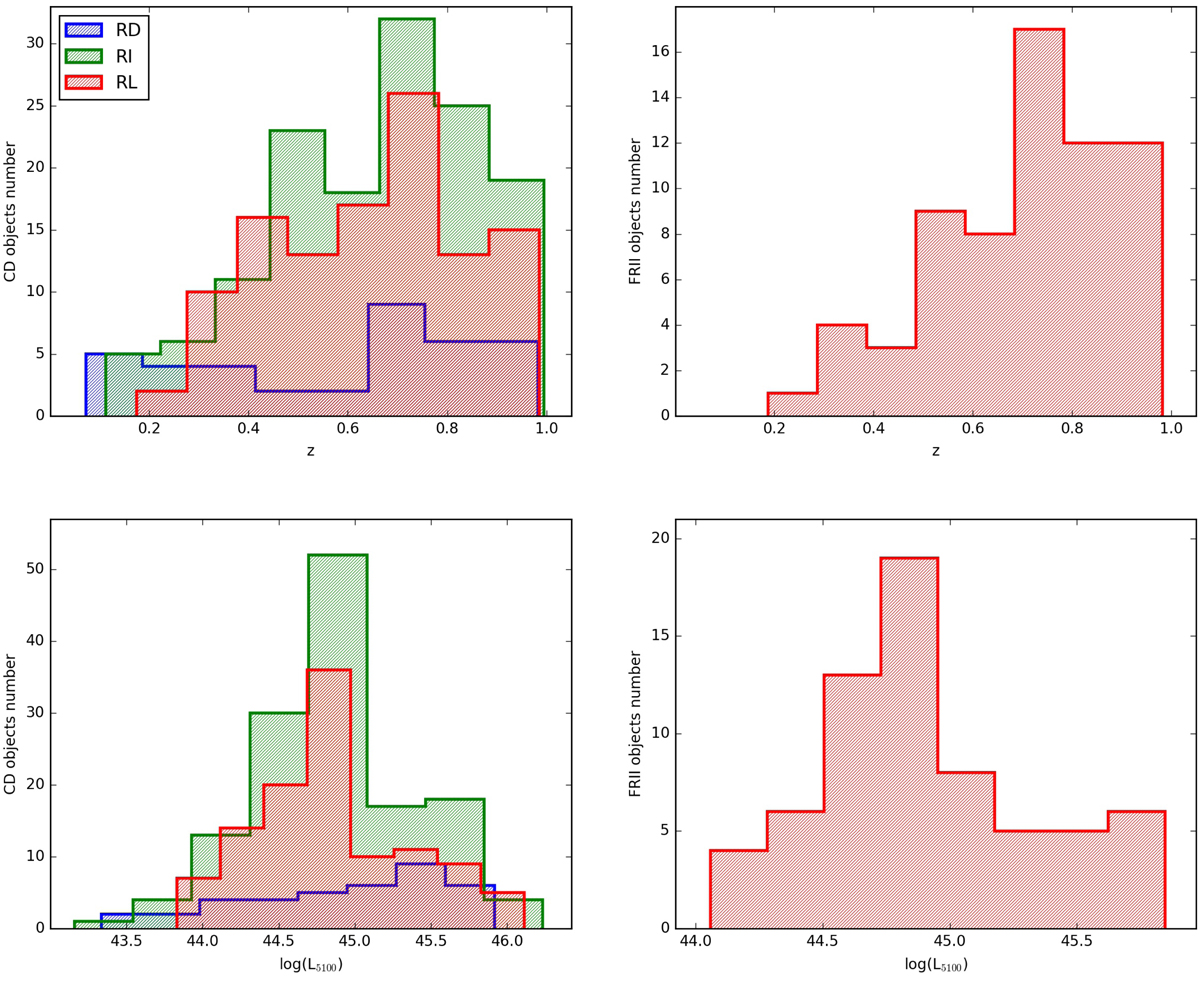
Redshift (top) and luminosity at 5100 Å (bottom) sample distributions. The left plots refer to CD sources, the right ones to FRII ones. Blue refers to the RD class, green to the RI one and red to the RL one.
Current usage metrics show cumulative count of Article Views (full-text article views including HTML views, PDF and ePub downloads, according to the available data) and Abstracts Views on Vision4Press platform.
Data correspond to usage on the plateform after 2015. The current usage metrics is available 48-96 hours after online publication and is updated daily on week days.
Initial download of the metrics may take a while.