Fig. 14.
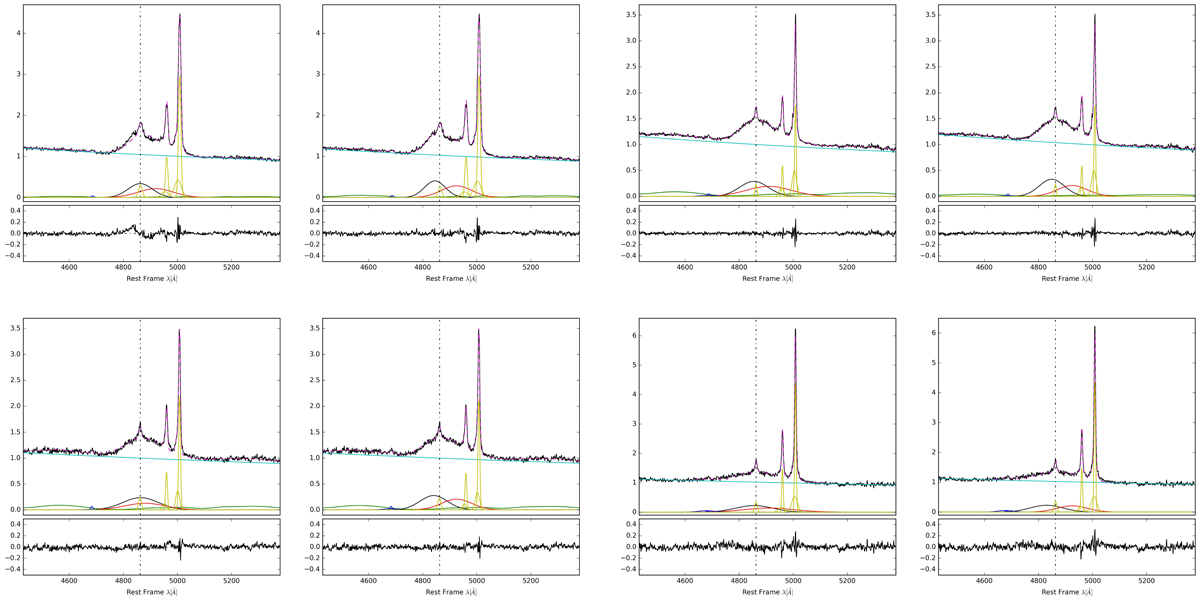
Comparison between broad + very broad and double broad Hβ fitting models. From left to right, top to bottom: CD-RD-B1+, CD-RI-B1+, CD-RL-B1+ and FRII-RL-B1++. For each pair the left plot represents the broad + very broad fitting BC+VBC model and the right plot represents the double broad component model BC+BD. Color scheme same as in Fig. 3.
Current usage metrics show cumulative count of Article Views (full-text article views including HTML views, PDF and ePub downloads, according to the available data) and Abstracts Views on Vision4Press platform.
Data correspond to usage on the plateform after 2015. The current usage metrics is available 48-96 hours after online publication and is updated daily on week days.
Initial download of the metrics may take a while.