Fig. 13.
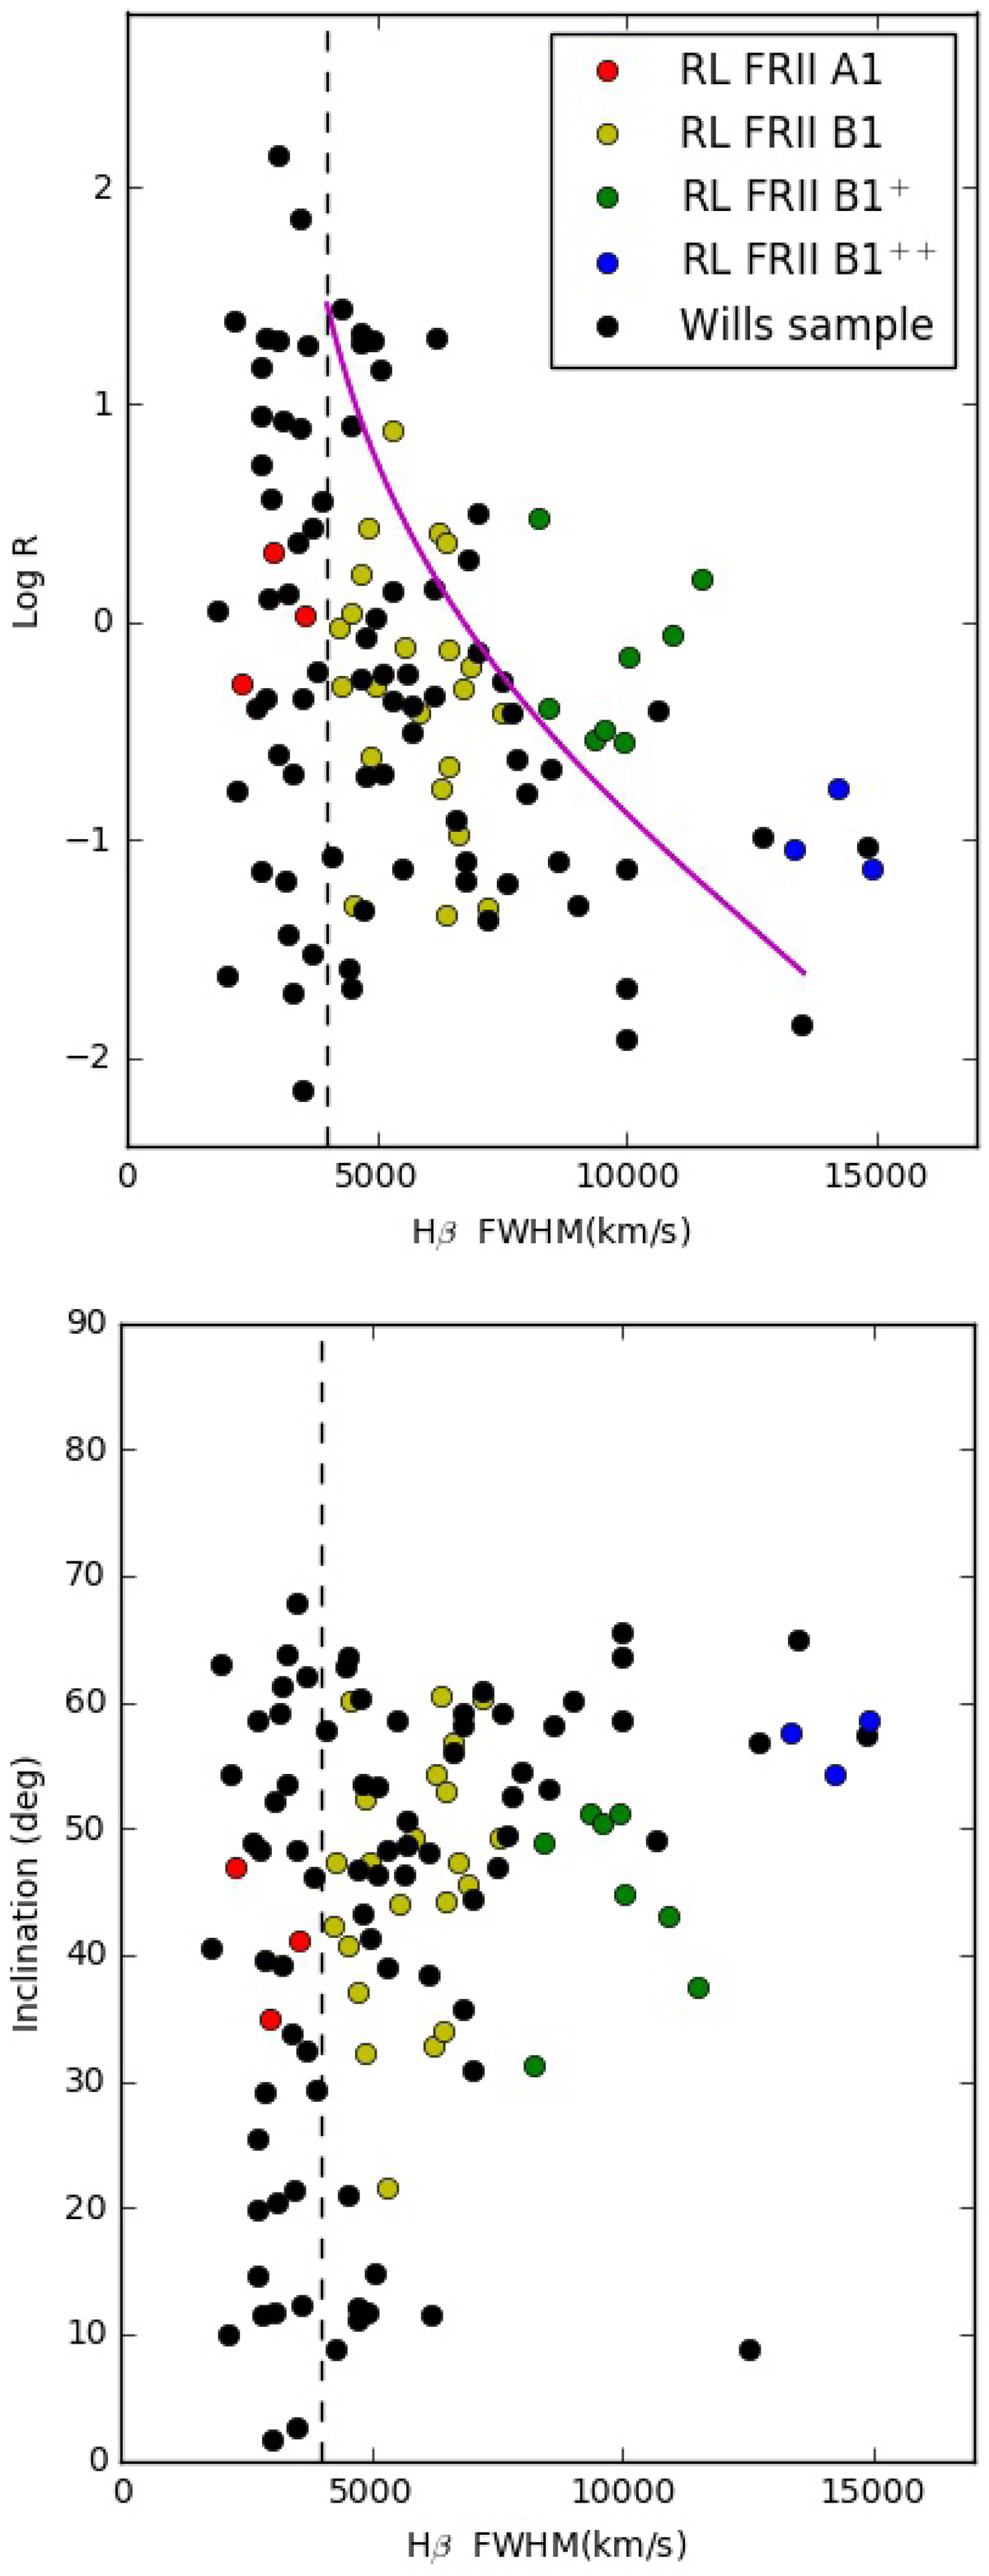
Top: core-to-lobe radio flux density ratio vs. FWHM(Hβ), adapted from Wills & Browne (1986). Colored dots represent sources of our sample: red dots represent A1 RL FRII sources, yellow dots B1 RL FRII, green B1+ RL FRII and blue ones B1++ RL FRII. Black dots are the original data from Wills & Browne (1986). The magenta line represents the change of R with FWHM(β), predicted by the Orr & Browne (1982) beaming model with RT = 0.024 and γ = 5. Bottom: FWHM(β) vs. inclination, derived from Rc through Eq. (16).
Current usage metrics show cumulative count of Article Views (full-text article views including HTML views, PDF and ePub downloads, according to the available data) and Abstracts Views on Vision4Press platform.
Data correspond to usage on the plateform after 2015. The current usage metrics is available 48-96 hours after online publication and is updated daily on week days.
Initial download of the metrics may take a while.