Fig. 10.
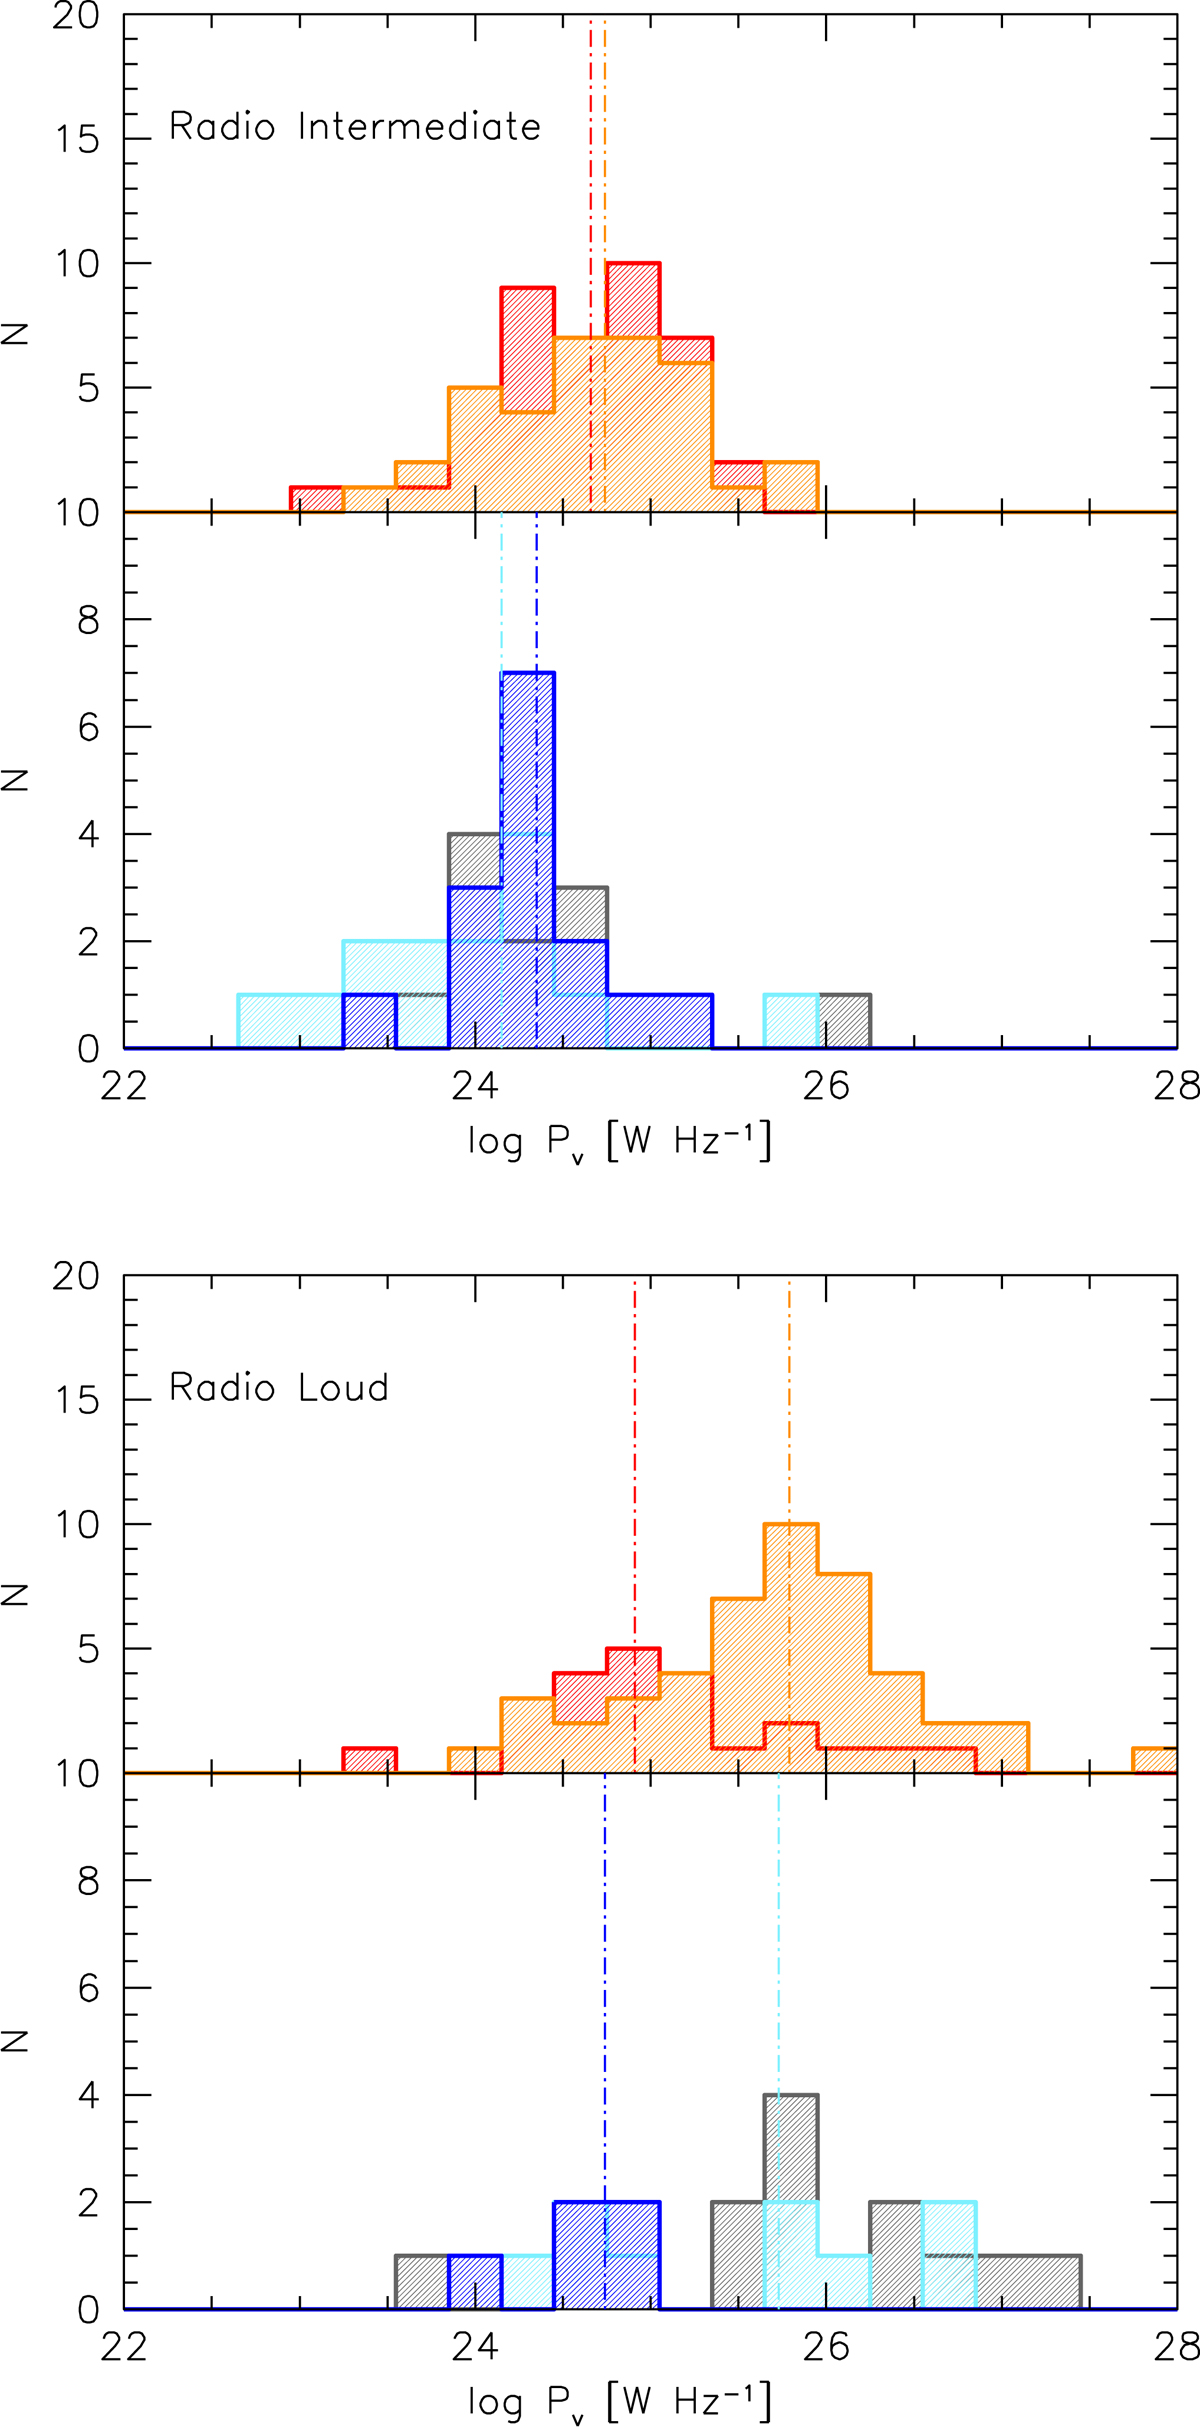
Distribution of radio power Pν in units of W for RI (top) and RL (bottom), for different spectral types along MS. Top panels: distributions for the union of B1++ and B1+ (red), B1 (orange) spectral types, the bottom ones for A1 (gray), pale blue (A2), and xA (blue). The vertical dot-dashed lines mark the medians of the Pop. B (red and orange), A2 (pale blue) and xA (blue) distributions.
Current usage metrics show cumulative count of Article Views (full-text article views including HTML views, PDF and ePub downloads, according to the available data) and Abstracts Views on Vision4Press platform.
Data correspond to usage on the plateform after 2015. The current usage metrics is available 48-96 hours after online publication and is updated daily on week days.
Initial download of the metrics may take a while.