Fig. 1.
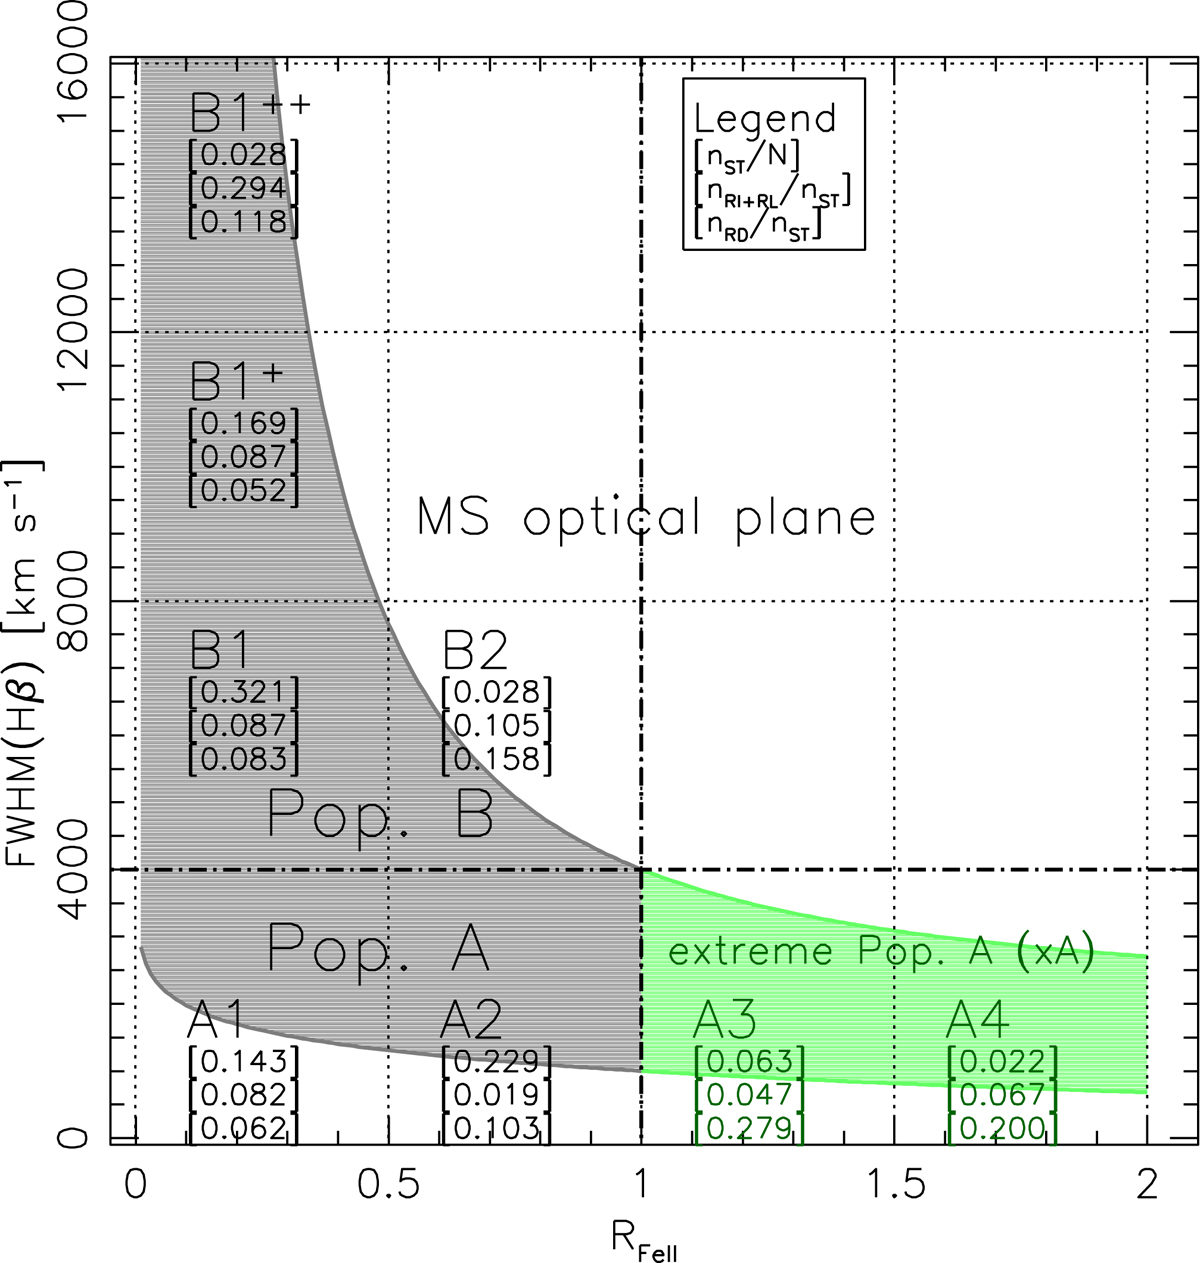
Sketch illustrating definition of STs along MS, as function of RFeII and FWHM(Hβ). The numbers in square brackets yield from top to bottom, the prevalences of each spectral bin (nST) in an optically selected sample (Marziani et al. 2013), of the RI and RL sources (nRI + RL) and of RD (nRD) in each spectral bin. The total number of sources is N = 680. The gray and pale green ares trace the source occupation in the plane; the green area separates extreme Population A from the rest of the MS.
Current usage metrics show cumulative count of Article Views (full-text article views including HTML views, PDF and ePub downloads, according to the available data) and Abstracts Views on Vision4Press platform.
Data correspond to usage on the plateform after 2015. The current usage metrics is available 48-96 hours after online publication and is updated daily on week days.
Initial download of the metrics may take a while.