Fig. 9
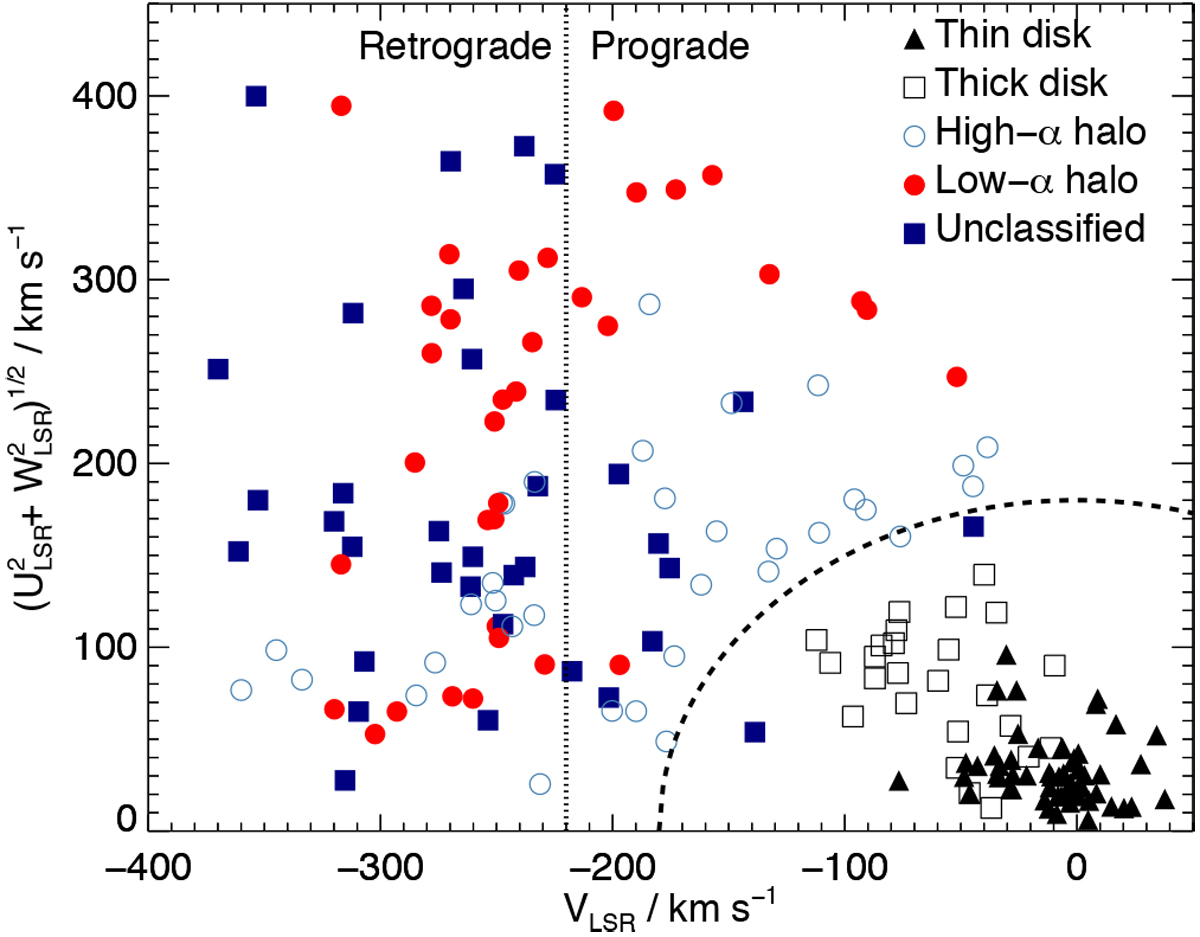
Toomre diagram for the entire stellar sample, corrected for the peculiar solar motion using Coşkunoǧlu et al. (2011). The kinematic information are primarily from Gaia DR2 (Gaia Collaboration 2018), but for some stars where these data were missing the kinematic information come from other sources (Perryman et al. 1997; Nissen & Schuster 2010; Anderson & Francis 2012; Carollo et al. 2014; Kunder et al. 2017). The unclassified stars are from the VLT/UVES sample. The vertical dashed line delineates prograde and retrograde orbits, while the curved dashed line indicates a total velocity of 180 km s−1.
Current usage metrics show cumulative count of Article Views (full-text article views including HTML views, PDF and ePub downloads, according to the available data) and Abstracts Views on Vision4Press platform.
Data correspond to usage on the plateform after 2015. The current usage metrics is available 48-96 hours after online publication and is updated daily on week days.
Initial download of the metrics may take a while.