Fig. 7
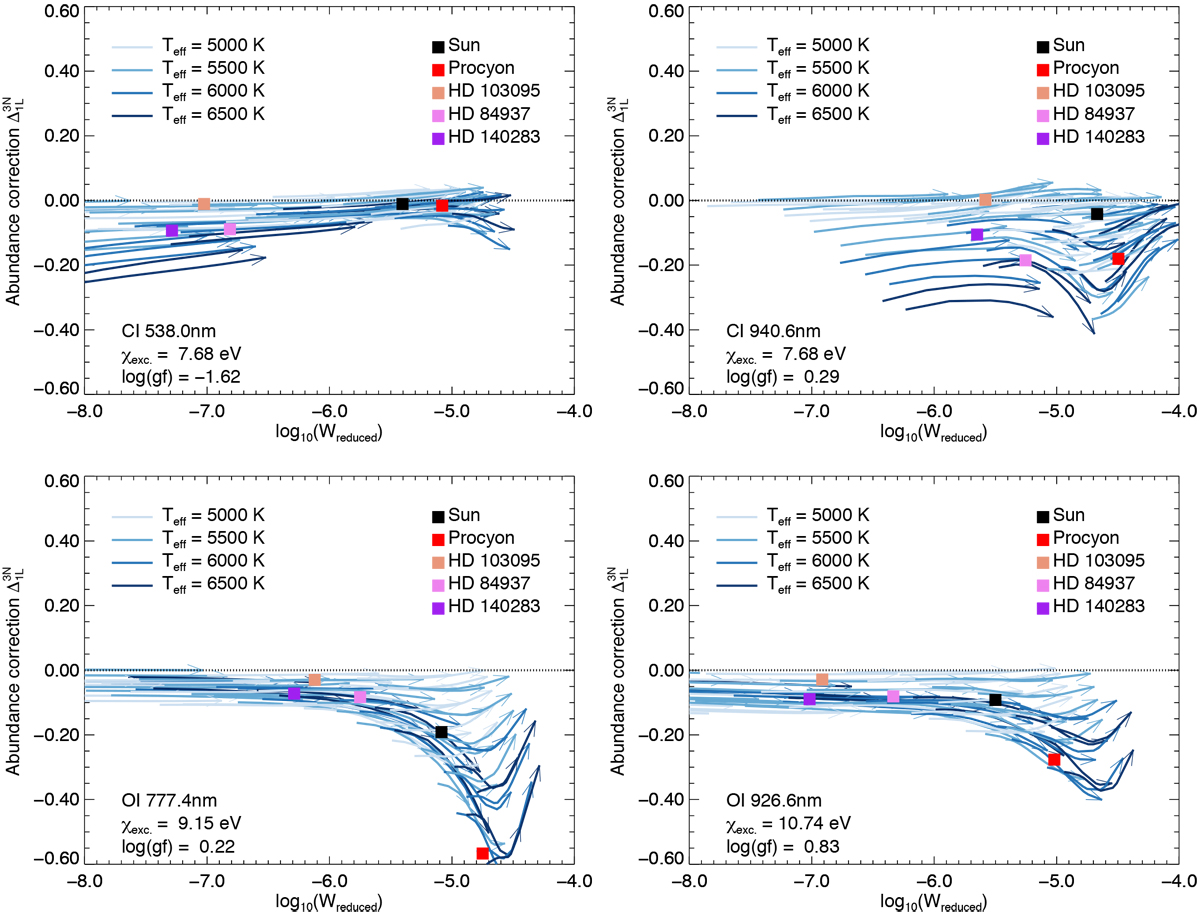
3D non-LTE versus 1D LTE abundance corrections as functions of 3D non-LTE reduced equivalent widths, Wreduced = W∕λ, for different C I and O I lines. The arrows show how the results change by increasing log ɛC and log ɛO respectively, and the curves are for fixed effective temperatures, surface gravities and metallicities, roughly corresponding to the nodes of the 3D STAGGER grid in Fig. 1. The 1D microturbulence was fixed to ξmic = 1.0 km s−1. Also plotted are approximate abundance corrections for reference dwarfs, adopting the stellar parameterslisted in Table 1 of Amarsi et al. (2018b) and assuming 3D non-LTE abundance ratios of [C/Fe] = [O/Fe] = 0.0 for the Sun and Procyon, and of [C/Fe] = 0.0 and [O/Fe] = 0.4 for the metal-poor stars. The effective temperature of Procyon (Teff ≈ 6556 K) lies slightly outside of the grid of 3D models and the abundance corrections are extrapolated here.
Current usage metrics show cumulative count of Article Views (full-text article views including HTML views, PDF and ePub downloads, according to the available data) and Abstracts Views on Vision4Press platform.
Data correspond to usage on the plateform after 2015. The current usage metrics is available 48-96 hours after online publication and is updated daily on week days.
Initial download of the metrics may take a while.