Open Access
Fig. 5
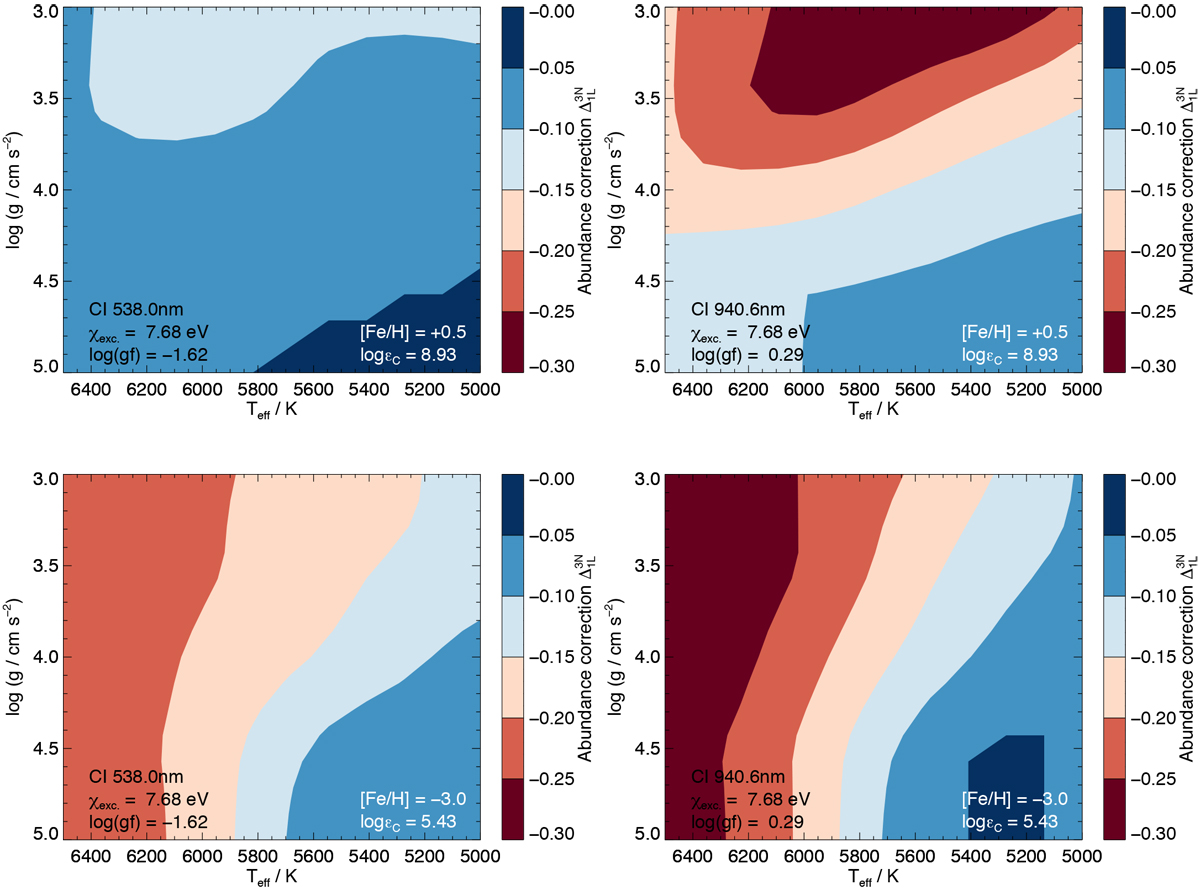
Kiel diagram of 3D non-LTE versus 1D LTE abundance corrections for different C I lines (columns), at different metallicities and carbon abundances (rows). The 1D microturbulence was fixed to ξmic = 1.0 km s−1.
Current usage metrics show cumulative count of Article Views (full-text article views including HTML views, PDF and ePub downloads, according to the available data) and Abstracts Views on Vision4Press platform.
Data correspond to usage on the plateform after 2015. The current usage metrics is available 48-96 hours after online publication and is updated daily on week days.
Initial download of the metrics may take a while.