Fig. 3
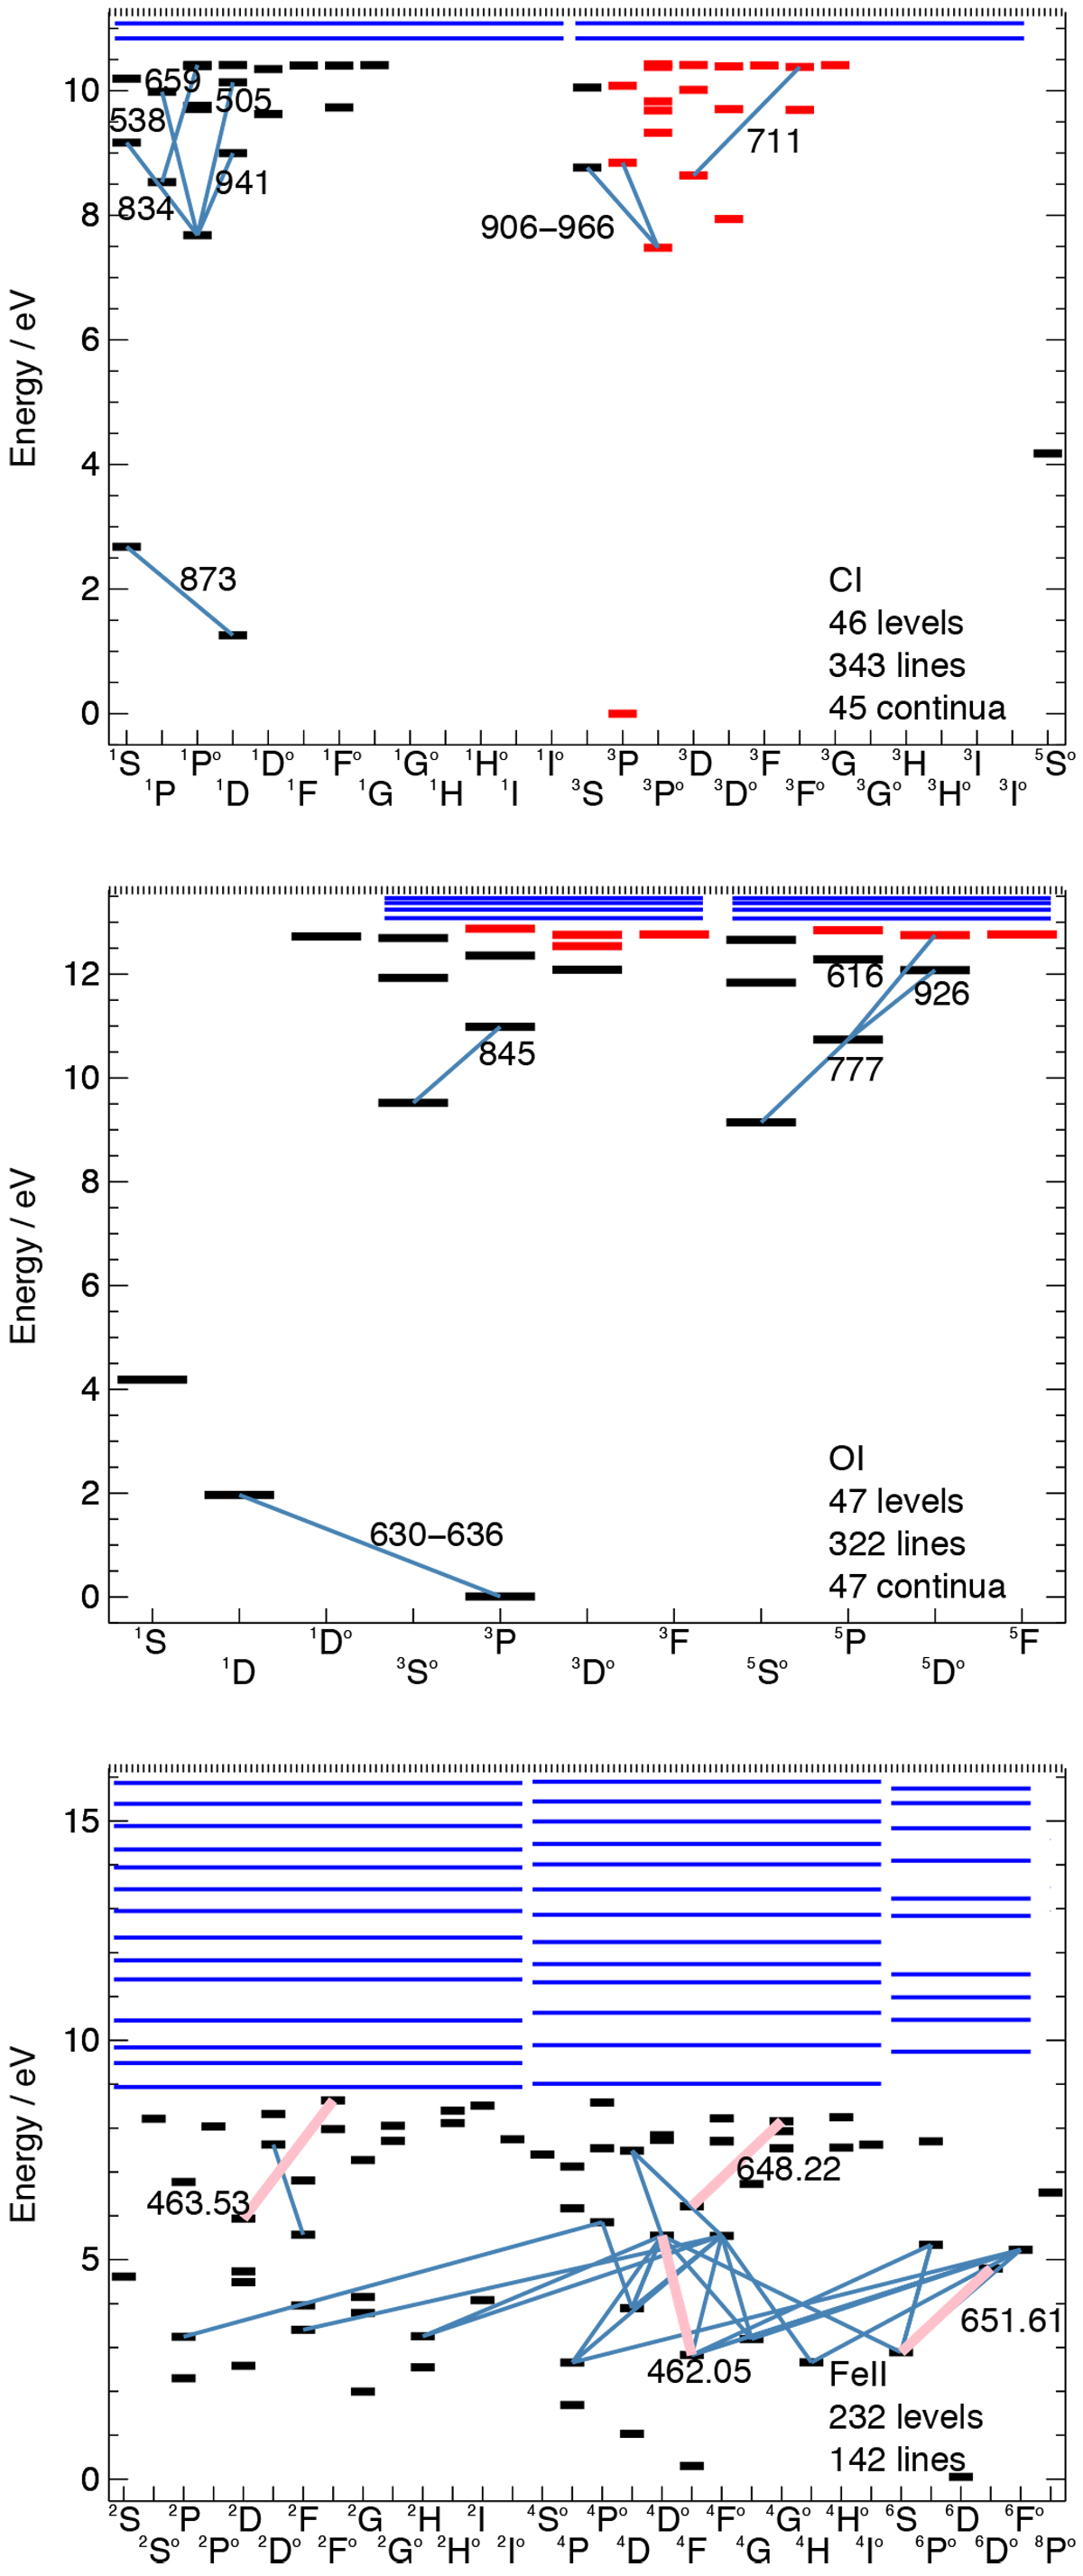
Grotrian term diagrams of the atomic models for C I and O I used for the non-LTE iterations. Also shown is a Grotrian term diagram for Fe II, based on which LTE emergent line fluxes were calculated. Levels for which fine structure has been collapsed are shown in red, and super levels are shown as long horizontal blue lines at the top of the figures. The transitions for which emergent line fluxes and abundance corrections were calculated are shown, connecting different energy levels. Their approximate wavelengths in air (nm) are indicated; for Fe II this is done only for the four lines for which the 3D LTE versus 1D LTE abundance corrections are shown in Fig. 8.
Current usage metrics show cumulative count of Article Views (full-text article views including HTML views, PDF and ePub downloads, according to the available data) and Abstracts Views on Vision4Press platform.
Data correspond to usage on the plateform after 2015. The current usage metrics is available 48-96 hours after online publication and is updated daily on week days.
Initial download of the metrics may take a while.