Fig. 7.
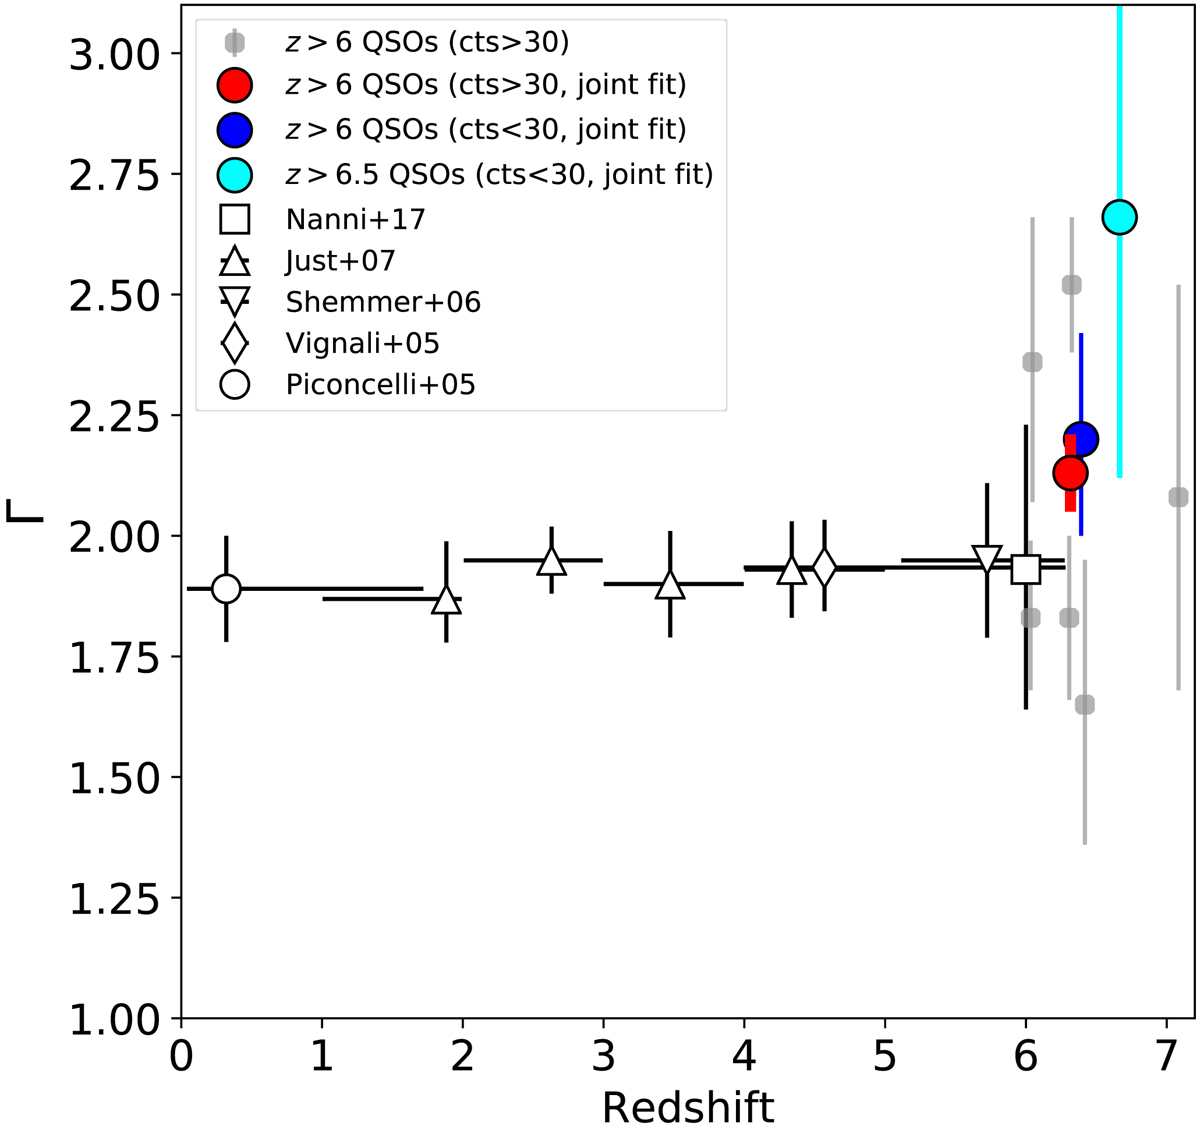
Photon index as function of redshift. We report the individual best-fitting values for sources with > 30 total net counts (gray symbols), the results derived from joint spectral analysis of QSOs with > 30, < 30 net counts, and of z > 6.5 QSOs (red, blue, and cyan circles, respectively, plotted at the median redshift of each subsample), and the average photon indices derived by Piconcelli et al. (2005), Vignali et al. (2005), Shemmer et al. (2006b), Just et al. (2007), and Nanni et al. (2017) for optically selected luminous QSOs at different redshifts. Errors are at the 68% confidence level.
Current usage metrics show cumulative count of Article Views (full-text article views including HTML views, PDF and ePub downloads, according to the available data) and Abstracts Views on Vision4Press platform.
Data correspond to usage on the plateform after 2015. The current usage metrics is available 48-96 hours after online publication and is updated daily on week days.
Initial download of the metrics may take a while.