Fig. 6.
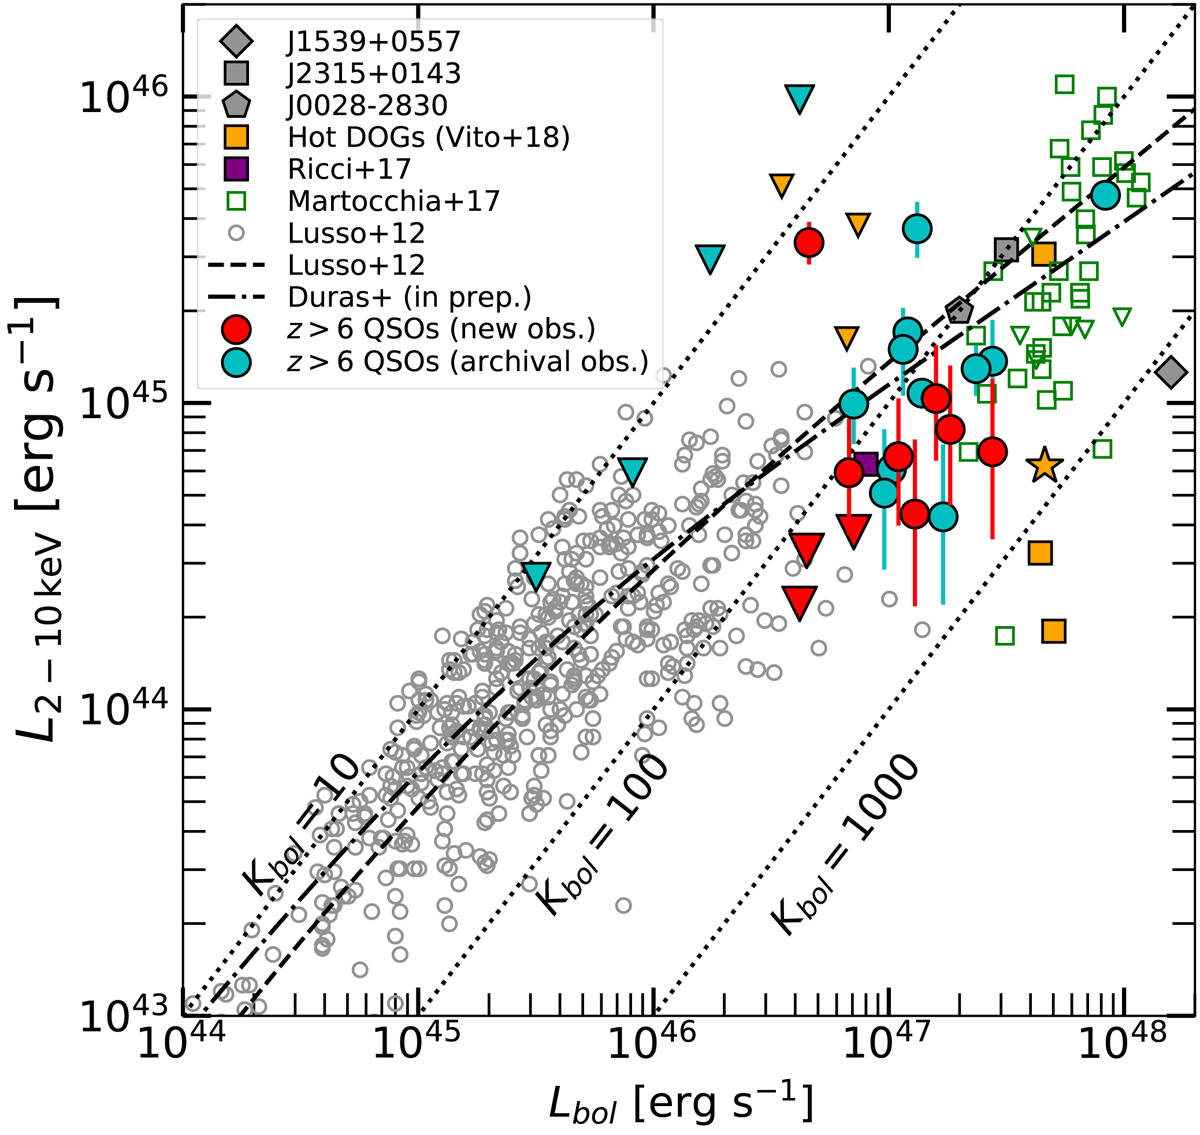
X-ray vs. bolometric luminosity of our sample of z > 6 QOSs (red and cyan symbols). We compared our results with the compilation of lower luminosity QSOs of Lusso et al. (2012, empty gray circles). We also add the sample of luminous QSOs from Martocchia et al. (2017, green symbols), the Hot DOG samples of Vito et al. (2018, orange symbols; the orange star represents the stacked result of several Hot DOGs undetected in the X-rays) and Ricci et al. (2017, purple square), and results for some individual hyperluminous QSOs (filled gray symbols; see Martocchia et al. 2017 for their luminosities Feruglio et al. 2014; Banerji et al. 2015; Cano-Díaz et al. 2012). The dashed and dash-dotted black curves are the best-fitting relation of Lusso et al. (2012) and Duras et al. (in prep.), respectively. Downward pointing triangles represent upper limits. Diagonal dotted lines mark the loci of constant bolometric correction.
Current usage metrics show cumulative count of Article Views (full-text article views including HTML views, PDF and ePub downloads, according to the available data) and Abstracts Views on Vision4Press platform.
Data correspond to usage on the plateform after 2015. The current usage metrics is available 48-96 hours after online publication and is updated daily on week days.
Initial download of the metrics may take a while.